Sasmirala Individual Information for 4C +73.08
Description
4C +73.08 is a FR II radio source identified with the compact galaxy VII Zw 292 [mayer_multifrequency_1979] at a redshift of z = 0.0581 (D ~ 271 Mpc) with a little-studied AGN. We treat the AGN as Sy 2, based on the existence of only narrow emission lines [saunders_spectrophotometry_1989]. It features megaparsec-scale radio lobes (PA~ 65∘; [mayer_multifrequency_1979]). 4C +73.08 was first detected in the MIR with Spitzer/IRAC and MIPS, where it appears point-like. Our MIPS 24 μm photometry agrees with the value given in [dicken_origin_2010]. No MIR spectrum is available for this object. The Spitzer photometry indicates a red spectral slope in the MIR in νFν-space. We observed 4C +73.08 with COMICS in the N11.7 filter in 2009 and weakly detected a compact source. The low S/N of the detection does not allow for any conclusion about the nuclear extension on subarcsecond scales in the MIR. The nuclear N11.7 flux is consistent with the Spitzer photometry.
- [dicken_origin_2010] D. Dicken, C. Tadhunter, D. Axon, A. Robinson, R. Morganti, and P. Kharb. The origin of the infrared emission in radio galaxies. III. analysis of 3CRR objects . ApJ , 722 pp. 1333–1341, October 2010.
- [mayer_multifrequency_1979] C. J. Mayer. Multifrequency observations of 4C 73.08 - a new addition to the 3CR 'complete sample' . MNRAS , 186 pp. 99–106, January 1979.
- [saunders_spectrophotometry_1989] Richard Saunders, J. E. Baldwin, Steve Rawlings, P. J. Warner, and Lance Miller. Spectrophotometry of FRII radiogalaxies in an unbiased, low-redshift sample . MNRAS , 238 pp. 777–790, May 1989.
Images
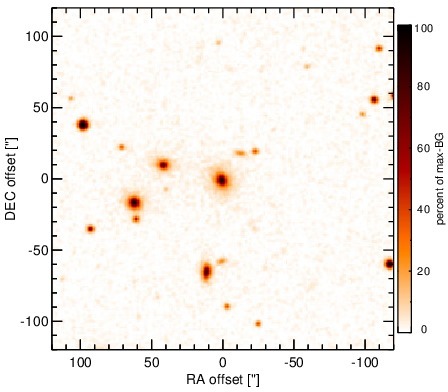
Optical image (DSS, red filter). Displayed are the central 4 arcmin with North being up and East to the left. The colour scaling is linear with white corresponding to the median background (BG) and black to the 0.01% pixels with the highest intensity.
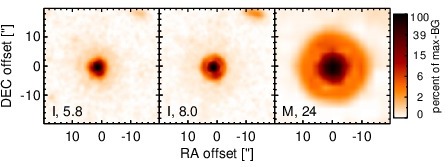
Spitzer MIR images. Displayed are the inner 40 arcsec with North being up and East to the left. The colour scaling is logarithmic with white corresponding to median BG and black to the 0.1% pixels with the highest intensity. The label in the bottom left states instrument and central wavelength of the filter in micron (I: IRAC, M: MIPS).
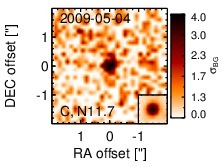
Subarcsecond-resolution MIR images sorted by increasing filter central wavelength. Displayed are the inner 4 arcsec with North being up and East to the left. The colour scaling is logarithmic with white corresponding to median BG and black to the 75% of the highest intensity of all images in units of sig_bg. The inset image (where present; either bottom or top right) shows the central arcsecond of the PSF from the calibrator star, scaled to match the science target. The labels in the bottom left state instrument and filter names (C: COMICS, M: Michelle, T: T-ReCS, V: VISIR).
SEDs
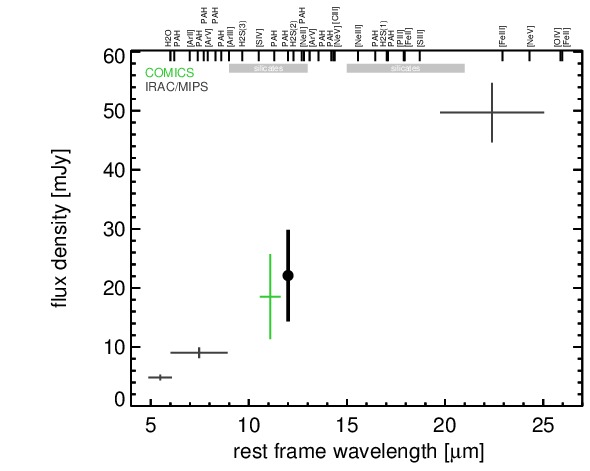
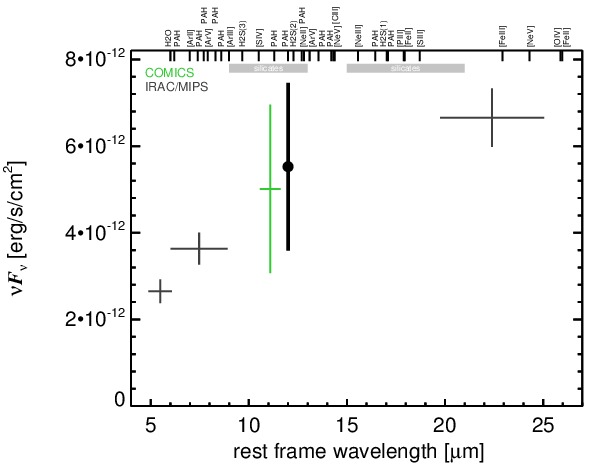
MIR SED. The description of the symbols in all the SED plots (where present) is the following: Grey crosses and solid lines mark the Spitzer/IRAC, MIPS and IRS data. The colour coding of the other symbols is as follows: green for COMICS, magenta for Michelle, blue for T-ReCS and red for VISIR data. Darker-coloured solid lines mark spectra of the corresponding instrument. The black filled circles mark the nuclear 12 and 18 micron continuum emission estimate from the data (where present). The ticks on the top axis mark positions of common MIR emission lines, while the light grey horizontal bars mark wavelength ranges affected by the silicate 10 and 18 micron features.