Sasmirala Individual Information for 1RXS J112716.6+190914
Description
1RXS J112716.6 is a radio-quiet low-luminosity quasar at a redshift of z = 0.1055 (D ~ 512 Mpc) with an optical Sy 1.8 classification [veron-cetty_catalogue_2010], discovered in the ROSAT all sky survey [voges_rosat_1999]. Since its discovery, it has been studied little but it is a member of the nine-month BAT AGN sample. No Spitzer data are available for this object. We observed 1RXS J112716.6 with VISIR in three narrow N-band filters in 2010 and weakly detected a compact nucleus. The VISIR observations in the NEII_1 filter are affected by poor ambient conditions as indicated from the poor sensitivity obtained from the corresponding standard star during that night. 1RXS J112716.6 appears rather point-like in the other two filters and features a flat N-band spectral slope in νFν-space.
- [veron-cetty_catalogue_2010] M.-P. Véron-Cetty and P. Véron. A catalogue of quasars and active nuclei: 13th edition . A&A , 518 pp. 10, July 2010.
- [voges_rosat_1999] W. Voges, B. Aschenbach, Th. Boller, H. Bräuninger, U. Briel, W. Burkert, K. Dennerl, J. Englhauser, R. Gruber, F. Haberl, G. Hartner, G. Hasinger, M. Kürster, E. Pfeffermann, W. Pietsch, P. Predehl, C. Rosso, J. H. M. M. Schmitt, J. Trümper, and H. U. Zimmermann. The ROSAT all-sky survey bright source catalogue . A&A , 349 pp. 389–405, September 1999.
Images
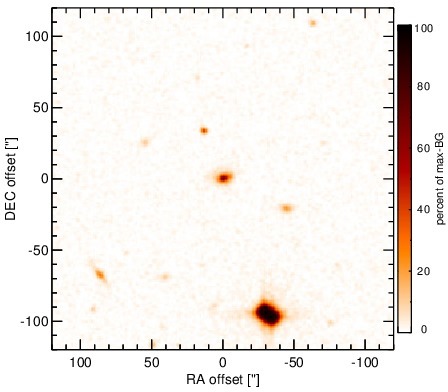
Optical image (DSS, red filter). Displayed are the central 4 arcmin with North being up and East to the left. The colour scaling is linear with white corresponding to the median background (BG) and black to the 0.01% pixels with the highest intensity.
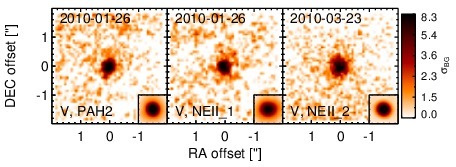
Subarcsecond-resolution MIR images sorted by increasing filter central wavelength. Displayed are the inner 4 arcsec with North being up and East to the left. The colour scaling is logarithmic with white corresponding to median BG and black to the 75% of the highest intensity of all images in units of sig_bg. The inset image (where present; either bottom or top right) shows the central arcsecond of the PSF from the calibrator star, scaled to match the science target. The labels in the bottom left state instrument and filter names (C: COMICS, M: Michelle, T: T-ReCS, V: VISIR).
SEDs
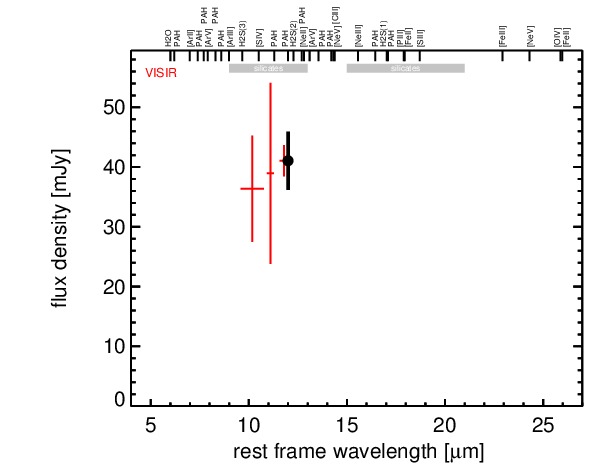
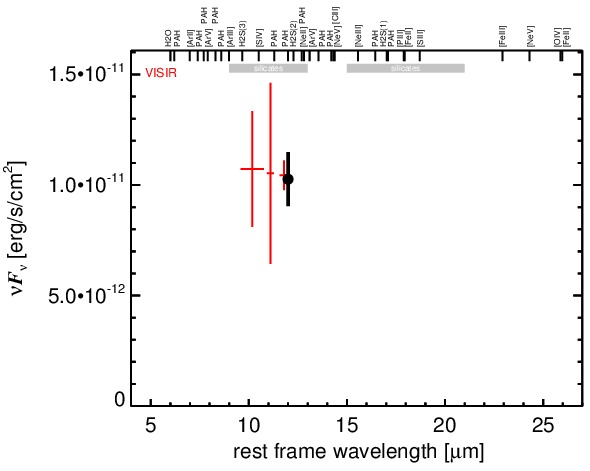
MIR SED. The description of the symbols in all the SED plots (where present) is the following: Grey crosses and solid lines mark the Spitzer/IRAC, MIPS and IRS data. The colour coding of the other symbols is as follows: green for COMICS, magenta for Michelle, blue for T-ReCS and red for VISIR data. Darker-coloured solid lines mark spectra of the corresponding instrument. The black filled circles mark the nuclear 12 and 18 micron continuum emission estimate from the data (where present). The ticks on the top axis mark positions of common MIR emission lines, while the light grey horizontal bars mark wavelength ranges affected by the silicate 10 and 18 micron features.