Sasmirala Individual Information for 2MASX J09180027+0425066
Description
2MASX J09180027 is a quasar at a redshift of z = 0.1564 (D ~ 781 Mpc) with an optical Sy 2 classification [veron-cetty_catalogue_2010]. It was only recently identified in the SDSS data [reyes_space_2008]. 2MASX J09180027 is also a member of the nine-month BAT AGN sample, but does not appear in later BAT catalogues. No Spitzer data are available for 2MASX J09180027 and it appears point-like in the WISE images. We observed this object with VISIR in the NEII_2 filter in 2010 and weakly detected a compact MIR source (the horizontal stripes in the image are instrumental artefacts).
- [reyes_space_2008] Reinabelle Reyes, Nadia L. Zakamska, Michael A. Strauss, Joshua Green, Julian H. Krolik, Yue Shen, Gordon T. Richards, Scott F. Anderson, and Donald P. Schneider. Space density of optically selected type 2 quasars . AJ , 136 pp. 2373–2390, December 2008.
- [veron-cetty_catalogue_2010] M.-P. Véron-Cetty and P. Véron. A catalogue of quasars and active nuclei: 13th edition . A&A , 518 pp. 10, July 2010.
Images
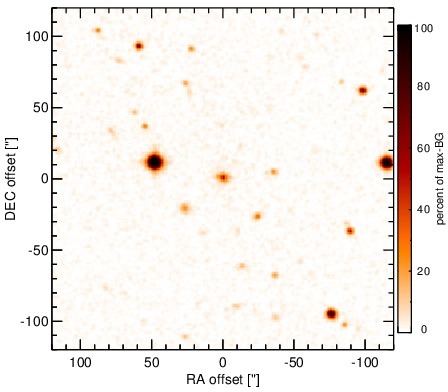
Optical image (DSS, red filter). Displayed are the central 4 arcmin with North being up and East to the left. The colour scaling is linear with white corresponding to the median background (BG) and black to the 0.01% pixels with the highest intensity.
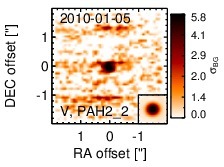
Subarcsecond-resolution MIR images sorted by increasing filter central wavelength. Displayed are the inner 4 arcsec with North being up and East to the left. The colour scaling is logarithmic with white corresponding to median BG and black to the 75% of the highest intensity of all images in units of sig_bg. The inset image (where present; either bottom or top right) shows the central arcsecond of the PSF from the calibrator star, scaled to match the science target. The labels in the bottom left state instrument and filter names (C: COMICS, M: Michelle, T: T-ReCS, V: VISIR).
SEDs
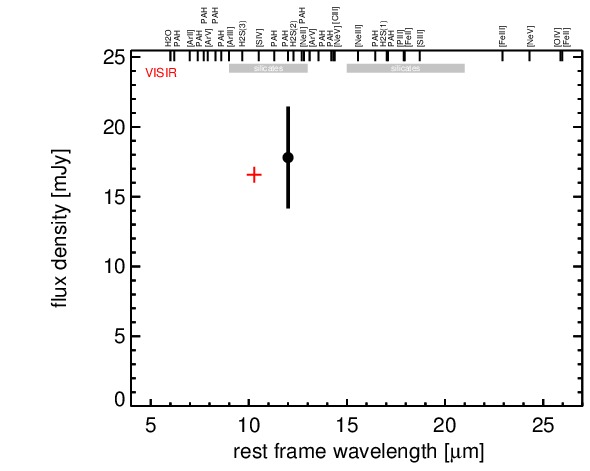
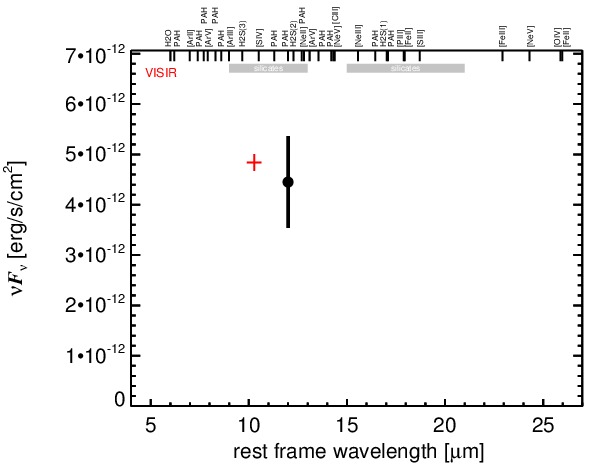
MIR SED. The description of the symbols in all the SED plots (where present) is the following: Grey crosses and solid lines mark the Spitzer/IRAC, MIPS and IRS data. The colour coding of the other symbols is as follows: green for COMICS, magenta for Michelle, blue for T-ReCS and red for VISIR data. Darker-coloured solid lines mark spectra of the corresponding instrument. The black filled circles mark the nuclear 12 and 18 micron continuum emission estimate from the data (where present). The ticks on the top axis mark positions of common MIR emission lines, while the light grey horizontal bars mark wavelength ranges affected by the silicate 10 and 18 micron features.