Sasmirala Individual Information for 3C 120
Description
3C 120 is a flat-spectrum FR I radio source coinciding with the lenticular galaxy Mrk 1506 at a redshift of z = 0.033 (D ~ 150 Mpc). It hosts a well-studied radio-loud Sy 1.5 AGN [veron-cetty_catalogue_2010], which also belongs to the nine-month BAT AGN sample. It is strongly variable at most wavelengths and possesses a prominent one-sided and bended jet extending from ~ 1 pc to ~ 100 kpc scales (PA~-95∘; [walker_radio_1987]). In addition, an extended NLR with complex morphology and extension parallel to the radio jet is present [hua_forbidden_1988]. 3C 120 was first observed at MIR wavelengths by [kleinmann_observations_1970] and [rieke_infrared_1972], followed by [rieke_infrared_1978, roche_8-13_1984, sparks_infrared_1986]. The first subarcsecond resolution observations were performed with Palomar 5 m/MIRLIN in 1999, where a point-like nucleus was detected [gorjian_10_2004]. 3C 120 was also observed with Spitzer/IRAC, IRS and MIPS and appears as compact source without any significant extended emission in the corresponding images. The IRS LR staring-mode spectrum is AGN-dominated and resembles a typical type I AGN SED with silicate emission, strong forbidden high-ionization lines, only weak PAH emission and a rather flat spectral slope in νFν-space (see also [thompson_dust_2009, leipski_spitzer_2009, wu_spitzer/irs_2009, tommasin_spitzer-irs_2010, mullaney_defining_2011]). 3C 120 was observed with VISIR in the SIC filter in 2006 [van_der_wolk_dust_2010], in three narrow N-band filters in 2009 (this work) and in the PAH1 filter in 2010 (unpublished, to our knowledge). A compact nucleus without further host or jet emission was detected in all images. The nuclear source seems slightly extended in all cases (FWHM ~ 0.43arcsec ~ 0.3 kpc), except in the sharpest image (SIC). Furthermore, the position angles do not agree for the different observations. Therefore, the general nuclear extension at subarcsecond scales in the MIR remains uncertain. The measured nuclear VISIR fluxes are on average ~ 12% lower than those exhibited by Spitzer and show significant dispersion. In particular, the oldest measurement, which is in the SIC filter, has the highest flux (consistent with the value in [van_der_wolk_dust_2010]), while the most recent measurement (PAH1) exhibits the lowest flux. The comparison with the historic measurements indicates possible MIR flux variations of the order of ~ 25% during the last four decades, which however is further complicated by the uncertain nuclear extension.
- [gorjian_10_2004] V. Gorjian, M. W. Werner, T. H. Jarrett, D. M. Cole, and M. E. Ressler. 10 micron imaging of seyfert galaxies from the 12 micron sample . ApJ , 605 pp. 156–167, April 2004.
- [hua_forbidden_1988] C. T. Hua. The forbidden o III 5007 a and h-alpha structure of the radio galaxy 3C 120 . A&A , 199 pp. 105–113, June 1988.
- [kleinmann_observations_1970] D. E. Kleinmann and F. J. Low. Observations of infrared galaxies . ApJL , 159 pp. L165, March 1970.
- [leipski_spitzer_2009] C. Leipski, R. Antonucci, P. Ogle, and D. Whysong. The spitzer view of FR i radio galaxies: On the origin of the nuclear mid-infrared continuum . ApJ , 701 pp. 891–914, August 2009.
- [mullaney_defining_2011] J. R. Mullaney, D. M. Alexander, A. D. Goulding, and R. C. Hickox. Defining the intrinsic AGN infrared spectral energy distribution and measuring its contribution to the infrared output of composite galaxies . MNRAS , page 474, April 2011.
- [rieke_infrared_1972] G. H. Rieke and F. J. Low. Infrared photometry of extragalactic sources . ApJL , 176 pp. L95, September 1972.
- [rieke_infrared_1978] G. H. Rieke. The infrared emission of seyfert galaxies . ApJ , 226 pp. 550–558, December 1978.
- [roche_8-13_1984] P. F. Roche, B. Whitmore, D. K. Aitken, and M. M. Phillips. 8-13 micron spectrophotometry of galaxies. II - 10 seyferts and 3C 273 . MNRAS , 207 pp. 35–45, March 1984.
- [sparks_infrared_1986] W. B. Sparks, J. H. Hough, D. J. Axon, and J. Bailey. Infrared photometry of the nuclei of early-type radio galaxies . MNRAS , 218 pp. 429–444, February 1986.
- [thompson_dust_2009] G. D. Thompson, N. A. Levenson, S. A. Uddin, and M. M. Sirocky. Dust emission from unobscured active galactic nuclei . ApJ , 697 pp. 182–193, May 2009.
- [tommasin_spitzer-irs_2010] Silvia Tommasin, Luigi Spinoglio, Matthew A. Malkan, and Giovanni Fazio. Spitzer-IRS high-resolution spectroscopy of the 12 μm seyfert galaxies. II. results for the complete data set . ApJ , 709 pp. 1257–1283, February 2010.
- [van_der_wolk_dust_2010] G. van der Wolk, P. D. Barthel, R. F. Peletier, and J. W. Pel. Dust tori in radio galaxies . A&A , 511 pp. 64, February 2010.
- [veron-cetty_catalogue_2010] M.-P. Véron-Cetty and P. Véron. A catalogue of quasars and active nuclei: 13th edition . A&A , 518 pp. 10, July 2010.
- [walker_radio_1987] R. C. Walker, J. M. Benson, and S. C. Unwin. The radio morphology of 3C 120 on scales from 0.5 parsecs to 400 kiloparsecs . ApJ , 316 pp. 546–572, May 1987.
- [wu_spitzer/irs_2009] Yanling Wu, Vassilis Charmandaris, Jiasheng Huang, Luigi Spinoglio, and Silvia Tommasin. Spitzer/IRS 5-35 μm low-resolution spectroscopy of the 12 μm seyfert sample . ApJ , 701 pp. 658–676, August 2009.
Images
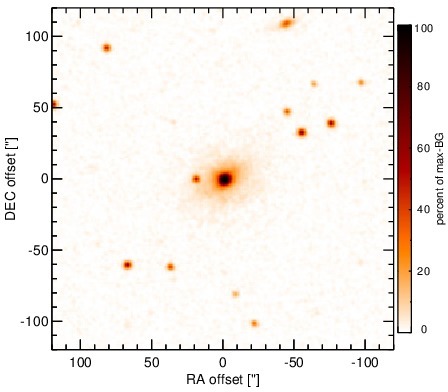
Optical image (DSS, red filter). Displayed are the central 4 arcmin with North being up and East to the left. The colour scaling is linear with white corresponding to the median background (BG) and black to the 0.01% pixels with the highest intensity.
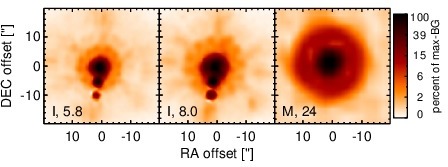
Spitzer MIR images. Displayed are the inner 40 arcsec with North being up and East to the left. The colour scaling is logarithmic with white corresponding to median BG and black to the 0.1% pixels with the highest intensity. The label in the bottom left states instrument and central wavelength of the filter in micron (I: IRAC, M: MIPS).
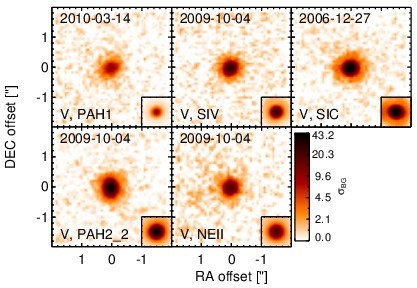
Subarcsecond-resolution MIR images sorted by increasing filter central wavelength. Displayed are the inner 4 arcsec with North being up and East to the left. The colour scaling is logarithmic with white corresponding to median BG and black to the 75% of the highest intensity of all images in units of sig_bg. The inset image (where present; either bottom or top right) shows the central arcsecond of the PSF from the calibrator star, scaled to match the science target. The labels in the bottom left state instrument and filter names (C: COMICS, M: Michelle, T: T-ReCS, V: VISIR).
SEDs
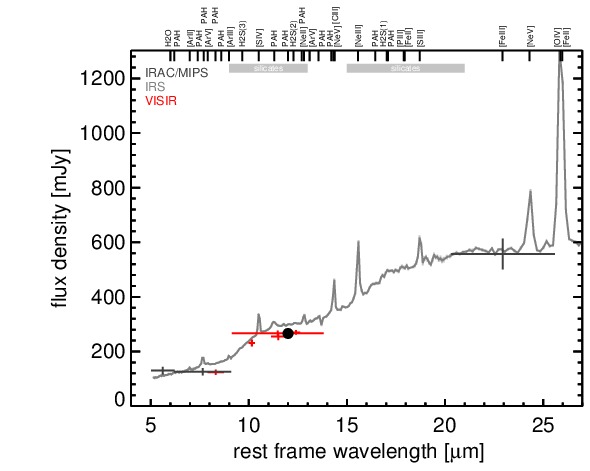
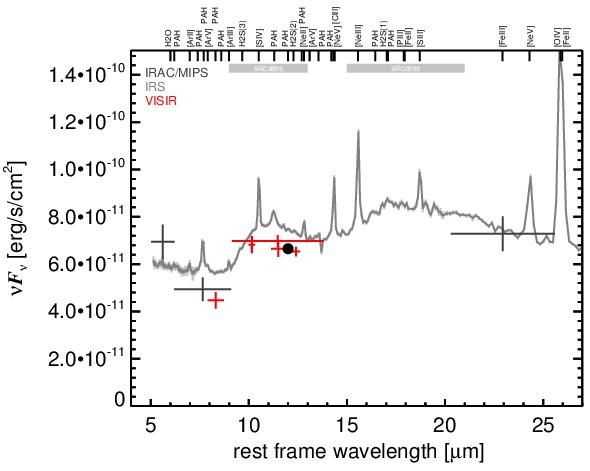
MIR SED. The description of the symbols in all the SED plots (where present) is the following: Grey crosses and solid lines mark the Spitzer/IRAC, MIPS and IRS data. The colour coding of the other symbols is as follows: green for COMICS, magenta for Michelle, blue for T-ReCS and red for VISIR data. Darker-coloured solid lines mark spectra of the corresponding instrument. The black filled circles mark the nuclear 12 and 18 micron continuum emission estimate from the data (where present). The ticks on the top axis mark positions of common MIR emission lines, while the light grey horizontal bars mark wavelength ranges affected by the silicate 10 and 18 micron features.