Sasmirala Individual Information for 3C 264
Description
3C 264 is a FR I radio source coinciding with the elliptical galaxy NGC 3982 at a redshift of z = 0.0217 (D ~ 103 Mpc), containing a little-studied radio-loud AGN. [veron-cetty_catalogue_2010] do not give any optical classification for this object. Based on the absence of broad emission lines [buttiglione_optical_2009], we assume a tentative Sy 2/LINER classification for 3C 264. The first successful N-band photometry was performed with the MMT by [maiolino_low-luminosity_1995]. Spitzer/IRAC, IRS and MIPS data are available for 3C 264, which appears compact but resolved in the corresponding images. The IRS LR staring-mode spectrum exhibits PAH emission and a blue spectral slope in νFν-space (see also [leipski_spitzer_2009]). The PAH emission indicates significant star-formation in this object, which, however, has to be still rather moderate, considering the absence of large amounts of cool dust. We made two attempts to detect the nucleus of 3C 264 with COMICS N11.7 imaging in 2009 but without success. The derived flux upper limit is 68% lower than the Spitzer fluxes, indicating that extended host emission indeed dominates the MIR at arcsecond scales, while the AGN itself is much fainter.
- [buttiglione_optical_2009] S. Buttiglione, A. Capetti, A. Celotti, D. J. Axon, M. Chiaberge, F. D. Macchetto, and W. B. Sparks. An optical spectroscopic survey of the 3CR sample of radio galaxies with z < 0.3. i. presentation of the data . A&A , 495 pp. 1033–1060, March 2009.
- [leipski_spitzer_2009] C. Leipski, R. Antonucci, P. Ogle, and D. Whysong. The spitzer view of FR i radio galaxies: On the origin of the nuclear mid-infrared continuum . ApJ , 701 pp. 891–914, August 2009.
- [maiolino_low-luminosity_1995] R. Maiolino and G. H. Rieke. Low-luminosity and obscured seyfert nuclei in nearby galaxies . ApJ , 454 pp. 95, November 1995.
- [veron-cetty_catalogue_2010] M.-P. Véron-Cetty and P. Véron. A catalogue of quasars and active nuclei: 13th edition . A&A , 518 pp. 10, July 2010.
Images
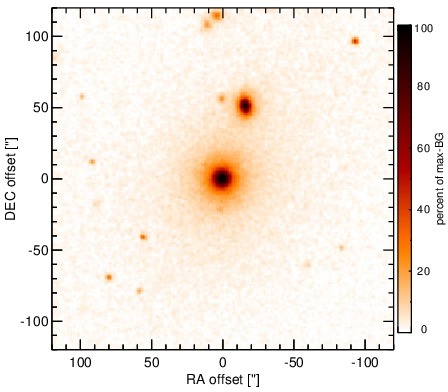
Optical image (DSS, red filter). Displayed are the central 4 arcmin with North being up and East to the left. The colour scaling is linear with white corresponding to the median background (BG) and black to the 0.01% pixels with the highest intensity.
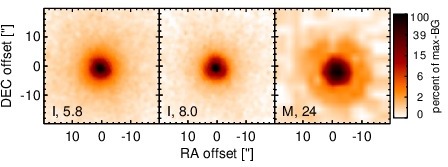
Spitzer MIR images. Displayed are the inner 40 arcsec with North being up and East to the left. The colour scaling is logarithmic with white corresponding to median BG and black to the 0.1% pixels with the highest intensity. The label in the bottom left states instrument and central wavelength of the filter in micron (I: IRAC, M: MIPS).
SEDs
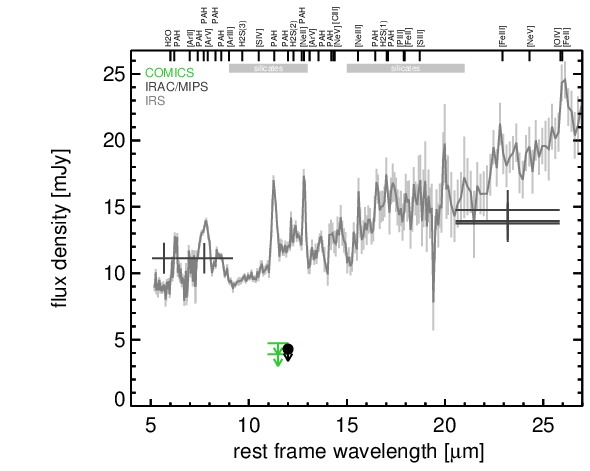
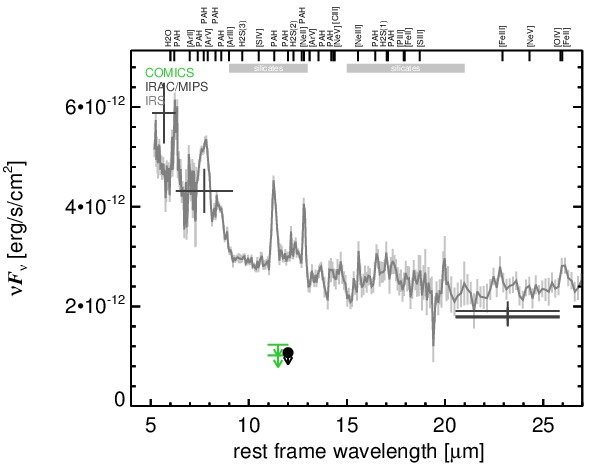
MIR SED. The description of the symbols in all the SED plots (where present) is the following: Grey crosses and solid lines mark the Spitzer/IRAC, MIPS and IRS data. The colour coding of the other symbols is as follows: green for COMICS, magenta for Michelle, blue for T-ReCS and red for VISIR data. Darker-coloured solid lines mark spectra of the corresponding instrument. The black filled circles mark the nuclear 12 and 18 micron continuum emission estimate from the data (where present). The ticks on the top axis mark positions of common MIR emission lines, while the light grey horizontal bars mark wavelength ranges affected by the silicate 10 and 18 micron features.