Sasmirala Individual Information for 3C 273
Description
3C 273 is the first discovered radio-loud quasar [schmidt_3c_1963] with a redshift of z = 0.1583 (D ~ 792 Mpc), a flat radio spectrum, and a Sy 1 optical classification [veron-cetty_catalogue_2010]. It is one of the best studied AGN with a one-sided jet oriented to the south-west (see [courvoisier_bright_1998] for a review). The source emission appears beamed, and thus 3C 273 is also classified as a blazar. This object is strongly variable at all frequencies (e.g., [soldi_multiwavelength_2008]), including the MIR where the variability is up to 60% [neugebauer_infrared_1984]. It is also among the first AGN at MIR wavelengths with a few decades of N-band coverage [low_spectrum_1965, kleinmann_infrared_1970, rieke_infrared_1972, sitko_0.35-3.5_1982, roche_8-13_1984, neugebauer_continuum_1987]. The first subarcsecond-resolution N-band images were obtained with MIRLIN [gorjian_10_2004] and TIMMI2 [raban_core_2008]. 3C 273 also has multiple-epoch coverage in all Spitzer instruments. The first IRS spectrum was published by [hao_detection_2005] and shows weak silicate 10 μm emission and no PAH features, which indicates the presence of dust, although the SED is generally expected to be synchrotron-dominated. IRAC images were taken in 2007 and 2009, while MIPS was used to observe 3C 273 in 2004, 2006, 2007, and 2009. We find a maximum MIR variability of 17% around the median in the MIPS 24 μm band. Our measurement from the 2004 data agrees with [dicken_origin_2008]. The jet is visible in the IRAC and MIPS images, while the nucleus is otherwise compact (see also [uchiyama_shedding_2006]). VISIR images were take in multiple N-band filters in 2007 and 2011. The point-like nucleus was detected but no jet emission. Our flux measurements from the 2007 data agree with the published values from these data in [tristram_parsec-scale_2009]. Note the different beam shape and elongation direction of the central source in the three different nights of VISIR observations. However, the nucleus is unresolved in the sharpest and highest S/N images, and thus is classified as unresolved at subarcsecond scales in the MIR. 3C 273 was also observed with MIR interferometry with MIDI, where it appears only marginally resolved with a maximum size of the emitter of \⪅16 pc (~ 12 mas; [tristram_parsec-scale_2009, burtscher_diversity_2013]). Thus, the elongations seen in the VISIR images can not be real. The flux differences between the Spitzer and VISIR measurements are most likely caused by variability. To compute the nuclear 12 μm continuum emission we extrapolate from the PAH2_2 measurements assuming the median type I MIR SED.
- [burtscher_diversity_2013] L. Burtscher, K. Meisenheimer, K. R. W. Tristram, W. Jaffe, S. F. Hönig, R. I. Davies, M. Kishimoto, J.-U. Pott, H. Röttgering, M. Schartmann, G. Weigelt, and S. Wolf. A diversity of dusty AGN tori. data release for the VLTI/MIDI AGN large program and first results for 23 galaxies . A&A , 558 pp. 149, October 2013.
- [courvoisier_bright_1998] Thierry J.-L. Courvoisier. The bright quasar 3C 273 . A&ARv , 9 pp. 1–32, 1998.
- [dicken_origin_2008] D. Dicken, C. Tadhunter, R. Morganti, C. Buchanan, T. Oosterloo, and D. Axon. The origin of the infrared emission in radio galaxies. i. new mid- to far-infrared and radio observations of the 2 jy sample . ApJ , 678 pp. 712–728, May 2008.
- [gorjian_10_2004] V. Gorjian, M. W. Werner, T. H. Jarrett, D. M. Cole, and M. E. Ressler. 10 micron imaging of seyfert galaxies from the 12 micron sample . ApJ , 605 pp. 156–167, April 2004.
- [hao_detection_2005] Lei Hao, H. W. W. Spoon, G. C. Sloan, J. A. Marshall, L. Armus, A. G. G. M. Tielens, B. Sargent, I. M. van Bemmel, V. Charmandaris, D. W. Weedman, and J. R. Houck. The detection of silicate emission from quasars at 10 and 18 microns . ApJ , 625 pp. L75–L78, June 2005.
- [kleinmann_infrared_1970] D. E. Kleinmann and F. J. Low. Infrared observations of galaxies and of the extended nucleus in m82 . ApJL , 161 pp. L203, September 1970.
- [low_spectrum_1965] F. J. Low and H. L. Johnson. The spectrum of 3c 273. . ApJ , 141 pp. 336, January 1965.
- [neugebauer_continuum_1987] G. Neugebauer, R. F. Green, K. Matthews, M. Schmidt, B. T. Soifer, and J. Bennett. Continuum energy distributions of quasars in the palomar-green survey . ApJS , 63 pp. 615–644, March 1987.
- [neugebauer_infrared_1984] G. Neugebauer, H. J. Habing, R. van Duinen, H. H. Aumann, B. Baud, C. A. Beichman, D. A. Beintema, N. Boggess, P. E. Clegg, T. de Jong, J. P. Emerson, T. N. Gautier, F. C. Gillett, S. Harris, M. G. Hauser, J. R. Houck, R. E. Jennings, F. J. Low, P. L. Marsden, G. Miley, F. M. Olnon, S. R. Pottasch, E. Raimond, M. Rowan-Robinson, B. T. Soifer, R. G. Walker, P. R. Wesselius, and E. Young. The infrared astronomical satellite (IRAS) mission . ApJL , 278 pp. L1–L6, March 1984.
- [raban_core_2008] D. Raban, B. Heijligers, H. Röttgering, K. Meisenheimer, W. Jaffe, H. U. Käufl, and T. Henning. The core flux of the brightest 10 μm galaxies in the southern sky . A&A , 484 pp. 341–345, June 2008.
- [rieke_infrared_1972] G. H. Rieke and F. J. Low. Infrared photometry of extragalactic sources . ApJL , 176 pp. L95, September 1972.
- [roche_8-13_1984] P. F. Roche, B. Whitmore, D. K. Aitken, and M. M. Phillips. 8-13 micron spectrophotometry of galaxies. II - 10 seyferts and 3C 273 . MNRAS , 207 pp. 35–45, March 1984.
- [schmidt_3c_1963] M. Schmidt. 3C 273 : A star-like object with large red-shift . Nature , 197 pp. 1040, March 1963.
- [sitko_0.35-3.5_1982] M. L. Sitko, W. A. Stein, Y.-X. Zhang, and W. Z. Wisniewski. 0.35-3.5 micron photometry of x-ray emitting QSOs . ApJ , 259 pp. 486–494, August 1982.
- [soldi_multiwavelength_2008] S. Soldi, M. Türler, S. Paltani, H. D. Aller, M. F. Aller, G. Burki, M. Chernyakova, A. Lähteenmäki, I. M. McHardy, E. I. Robson, R. Staubert, M. Tornikoski, R. Walter, and T. J.-L. Courvoisier. The multiwavelength variability of 3C 273 . A&A , 486 pp. 411–425, August 2008.
- [tristram_parsec-scale_2009] K. R. W. Tristram, D. Raban, K. Meisenheimer, W. Jaffe, H. Röttgering, L. Burtscher, W. D. Cotton, U. Graser, Th. Henning, Ch. Leinert, B. Lopez, S. Morel, G. Perrin, and M. Wittkowski. Parsec-scale dust distributions in seyfert galaxies. results of the MIDI AGN snapshot survey . A&A , 502 pp. 67–84, July 2009.
- [uchiyama_shedding_2006] Yasunobu Uchiyama, C. Megan Urry, C. C. Cheung, Sebastian Jester, Jeffrey Van Duyne, Paolo Coppi, Rita M. Sambruna, Tadayuki Takahashi, Fabrizio Tavecchio, and Laura Maraschi. Shedding new light on the 3C 273 jet with the spitzer space telescope . ApJ , 648 pp. 910–921, September 2006.
- [veron-cetty_catalogue_2010] M.-P. Véron-Cetty and P. Véron. A catalogue of quasars and active nuclei: 13th edition . A&A , 518 pp. 10, July 2010.
Images
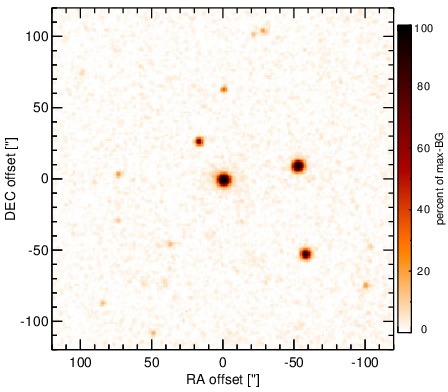
Optical image (DSS, red filter). Displayed are the central 4 arcmin with North being up and East to the left. The colour scaling is linear with white corresponding to the median background (BG) and black to the 0.01% pixels with the highest intensity.
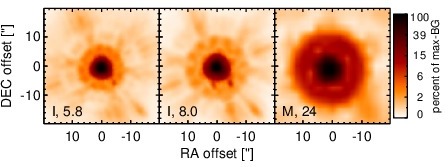
Spitzer MIR images. Displayed are the inner 40 arcsec with North being up and East to the left. The colour scaling is logarithmic with white corresponding to median BG and black to the 0.1% pixels with the highest intensity. The label in the bottom left states instrument and central wavelength of the filter in micron (I: IRAC, M: MIPS).
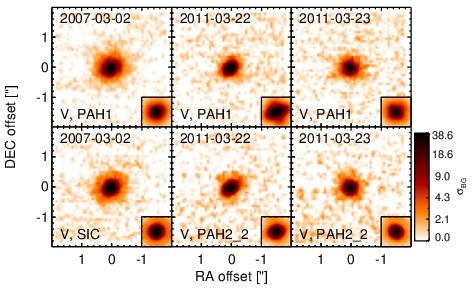
Subarcsecond-resolution MIR images sorted by increasing filter central wavelength. Displayed are the inner 4 arcsec with North being up and East to the left. The colour scaling is logarithmic with white corresponding to median BG and black to the 75% of the highest intensity of all images in units of sig_bg. The inset image (where present; either bottom or top right) shows the central arcsecond of the PSF from the calibrator star, scaled to match the science target. The labels in the bottom left state instrument and filter names (C: COMICS, M: Michelle, T: T-ReCS, V: VISIR).
SEDs
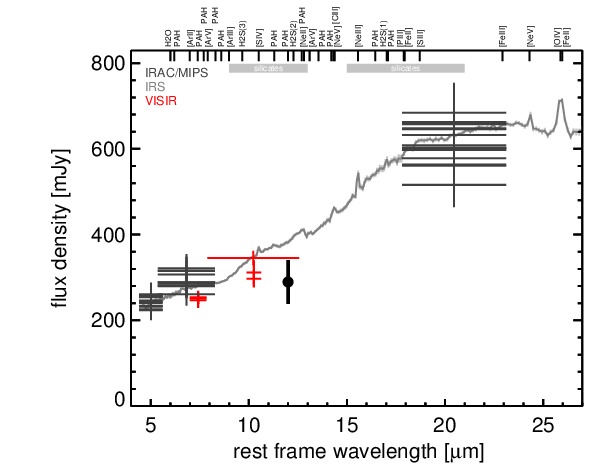
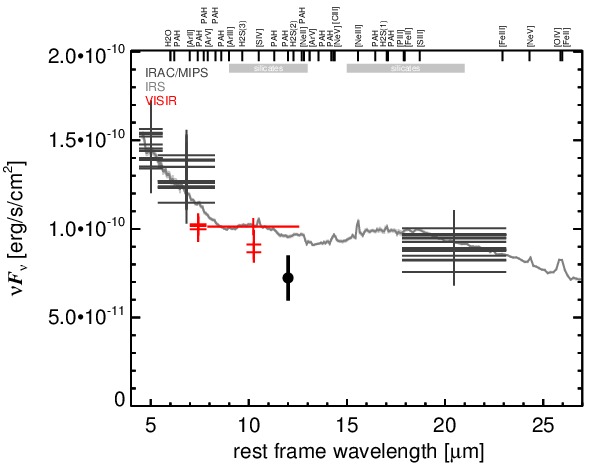
MIR SED. The description of the symbols in all the SED plots (where present) is the following: Grey crosses and solid lines mark the Spitzer/IRAC, MIPS and IRS data. The colour coding of the other symbols is as follows: green for COMICS, magenta for Michelle, blue for T-ReCS and red for VISIR data. Darker-coloured solid lines mark spectra of the corresponding instrument. The black filled circles mark the nuclear 12 and 18 micron continuum emission estimate from the data (where present). The ticks on the top axis mark positions of common MIR emission lines, while the light grey horizontal bars mark wavelength ranges affected by the silicate 10 and 18 micron features.