Sasmirala Individual Information for 3C 285
Description
3C 285 is a FR II radio source identified with the irregular galaxy LEDA 46625 (e.g., [allen_ultraviolet_2002]) at a redshift of z = 0.0794 (D ~ 378 Mpc), containing a radio-loud Sy 2 nucleus [veron-cetty_catalogue_2010]. Its supergalactic-scale biconical radio lobes extend an in the east-west directions (PA~ 75∘; e.g., [leahy_bridges_1984]). The first successful MIR detection of 3C 285 was achieved with Spitzer/IRAC, IRS and MIPS, where it appears nearly unresolved. Our nuclear MIPS 24 μm flux agrees with [dicken_origin_2010]. The IRS LR mapping-mode spectrum suffers from low S/N but shows silicate 10 μm absorption, PAH emission and a red spectral slope in νFν-space, indicating significant star formation (see also [dicken_spitzer_2012]). We attempted to detect 3C 285 with COMICS in the N11.7 filter in 2009 but without success. The corresponding upper limit of the nuclear N11.7 flux is ~ 64% lower than the Spitzer spectrophotometry. Therefore, star formation dominates the arcsecond-scale MIR SED of 3C 285, while it is resolved-out at subarcsecond resolution.
- [allen_ultraviolet_2002] Mark G. Allen, William B. Sparks, Anton Koekemoer, Andre R. Martel, Christopher P. O'Dea, Stefi A. Baum, Marco Chiaberge, F. Duccio Macchetto, and George K. Miley. Ultraviolet hubble space telescope snapshot survey of 3CR radio source counterparts at low redshift . ApJS , 139 pp. 411–438, April 2002.
- [dicken_origin_2010] D. Dicken, C. Tadhunter, D. Axon, A. Robinson, R. Morganti, and P. Kharb. The origin of the infrared emission in radio galaxies. III. analysis of 3CRR objects . ApJ , 722 pp. 1333–1341, October 2010.
- [dicken_spitzer_2012] D. Dicken, C. Tadhunter, D. Axon, R. Morganti, A. Robinson, M. B. N. Kouwenhoven, H. Spoon, P. Kharb, K. J. Inskip, J. Holt, C. Ramos Almeida, and N. P. H. Nesvadba. Spitzer mid-IR spectroscopy of powerful 2 jy and 3CRR radio galaxies. i. evidence against a strong starburst-AGN connection in radio-loud AGN . ApJ , 745 pp. 172, February 2012.
- [leahy_bridges_1984] J. P. Leahy and A. G. Williams. The bridges of classical double radio sources . MNRAS , 210 pp. 929–951, October 1984.
- [veron-cetty_catalogue_2010] M.-P. Véron-Cetty and P. Véron. A catalogue of quasars and active nuclei: 13th edition . A&A , 518 pp. 10, July 2010.
Images
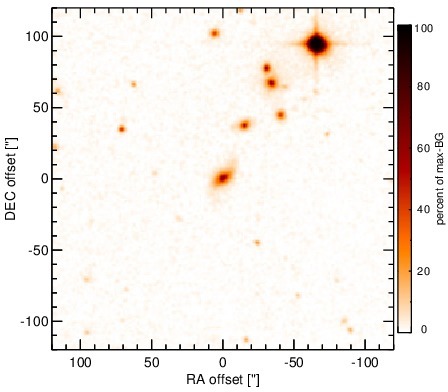
Optical image (DSS, red filter). Displayed are the central 4 arcmin with North being up and East to the left. The colour scaling is linear with white corresponding to the median background (BG) and black to the 0.01% pixels with the highest intensity.
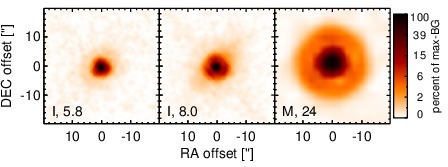
Spitzer MIR images. Displayed are the inner 40 arcsec with North being up and East to the left. The colour scaling is logarithmic with white corresponding to median BG and black to the 0.1% pixels with the highest intensity. The label in the bottom left states instrument and central wavelength of the filter in micron (I: IRAC, M: MIPS).
SEDs
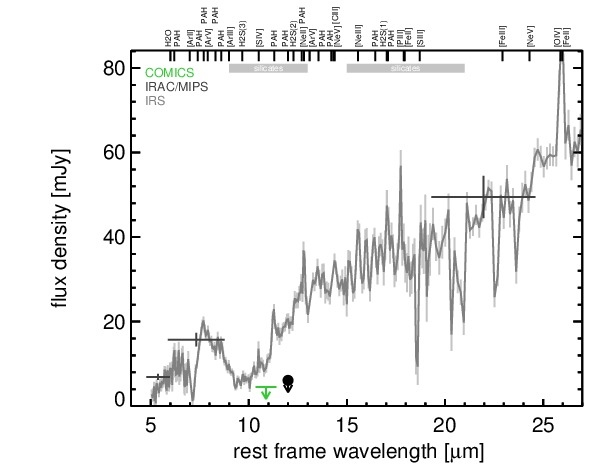
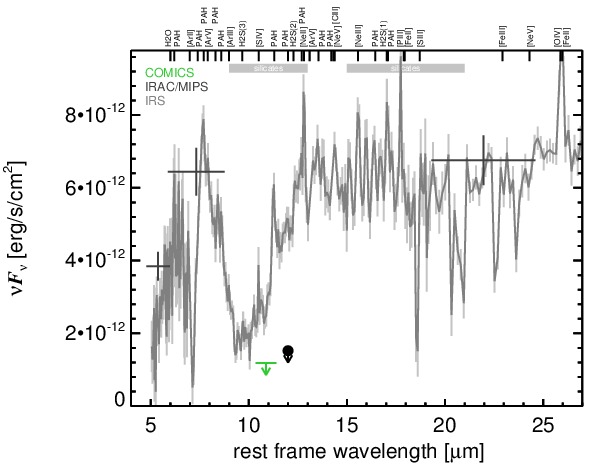
MIR SED. The description of the symbols in all the SED plots (where present) is the following: Grey crosses and solid lines mark the Spitzer/IRAC, MIPS and IRS data. The colour coding of the other symbols is as follows: green for COMICS, magenta for Michelle, blue for T-ReCS and red for VISIR data. Darker-coloured solid lines mark spectra of the corresponding instrument. The black filled circles mark the nuclear 12 and 18 micron continuum emission estimate from the data (where present). The ticks on the top axis mark positions of common MIR emission lines, while the light grey horizontal bars mark wavelength ranges affected by the silicate 10 and 18 micron features.