Sasmirala Individual Information for 3C 29
Description
3C 29 is a radio-loud AGN in an elliptical host galaxy at a redshift of z = 0.045 (D ~ 202 Mpc) with a FR I radio morphology and an optical LINER classification [veron-cetty_catalogue_2010]. It features supergalactic-scale biconical radio lobes in the north-south directions (PA~ 165∘; [morganti_radio_1993]). The Spitzer/IRAC and MIPS images are dominated by compact nuclear emission with only weak extended components in the IRAC 5.8 and 8 μm images. The Spitzer/IRS LR staring mode spectrum suffers from low S/N but indicates silicate emission and a shallow blue spectral slope in νFν-space (see also [leipski_spitzer_2009]). These authors attribute most of the MIR emission to non-thermal processes. 3C 29 was observed with VISIR in the SIC filter in 2006 but remained undetected [van_der_wolk_dust_2010]. Our corresponding derived upper limit for the nuclear flux is almost four times higher than that of [van_der_wolk_dust_2010] and also higher than the Spitzer spectrophotometry. Therefore, we use the latter to derive the upper limit of the nuclear 12 μm continuum emission.
- [leipski_spitzer_2009] C. Leipski, R. Antonucci, P. Ogle, and D. Whysong. The spitzer view of FR i radio galaxies: On the origin of the nuclear mid-infrared continuum . ApJ , 701 pp. 891–914, August 2009.
- [morganti_radio_1993] R. Morganti, N. E. B. Killeen, and C. N. Tadhunter. The radio structures of southern 2-JY radio sources . MNRAS , 263 pp. 1023, August 1993.
- [van_der_wolk_dust_2010] G. van der Wolk, P. D. Barthel, R. F. Peletier, and J. W. Pel. Dust tori in radio galaxies . A&A , 511 pp. 64, February 2010.
- [veron-cetty_catalogue_2010] M.-P. Véron-Cetty and P. Véron. A catalogue of quasars and active nuclei: 13th edition . A&A , 518 pp. 10, July 2010.
Images
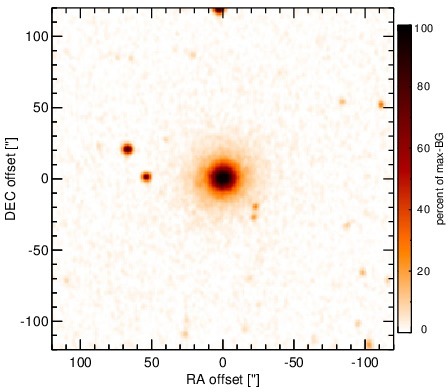
Optical image (DSS, red filter). Displayed are the central 4 arcmin with North being up and East to the left. The colour scaling is linear with white corresponding to the median background (BG) and black to the 0.01% pixels with the highest intensity.
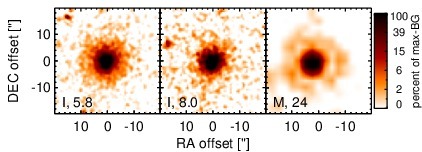
Spitzer MIR images. Displayed are the inner 40 arcsec with North being up and East to the left. The colour scaling is logarithmic with white corresponding to median BG and black to the 0.1% pixels with the highest intensity. The label in the bottom left states instrument and central wavelength of the filter in micron (I: IRAC, M: MIPS).
SEDs
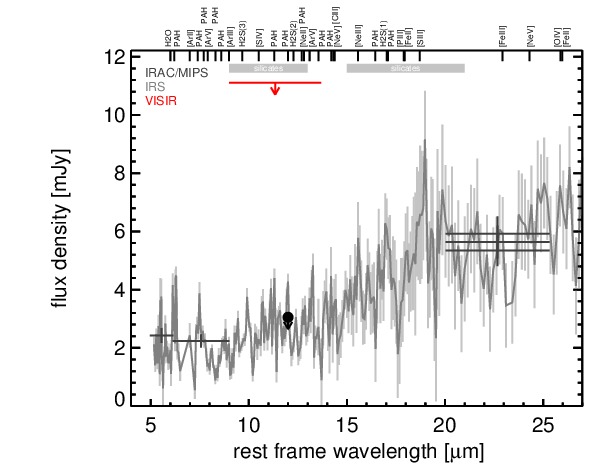
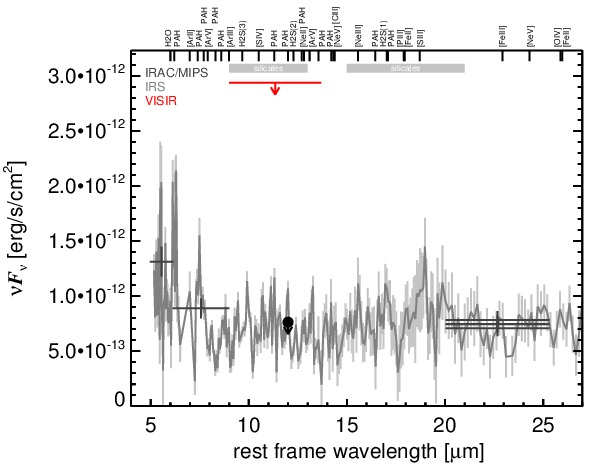
MIR SED. The description of the symbols in all the SED plots (where present) is the following: Grey crosses and solid lines mark the Spitzer/IRAC, MIPS and IRS data. The colour coding of the other symbols is as follows: green for COMICS, magenta for Michelle, blue for T-ReCS and red for VISIR data. Darker-coloured solid lines mark spectra of the corresponding instrument. The black filled circles mark the nuclear 12 and 18 micron continuum emission estimate from the data (where present). The ticks on the top axis mark positions of common MIR emission lines, while the light grey horizontal bars mark wavelength ranges affected by the silicate 10 and 18 micron features.