Sasmirala Individual Information for 3C 293
Description
3C 293 is a FR I radio source coinciding with the irregular galaxy UGC 8782 at a redshift of z = 0.045 (D ~ 311 Mpc) and an AGN optically classified as a LINER [veron-cetty_catalogue_2010]. It features a complex radio morphology with asymmetrical supergalactic-scale radio lobes and a misaligned inner two-sided jet (PA~-55∘ and PA~-85∘ respectively; e.g., [akujor_two-sided_1996, beswick_high-resolution_2004, giovannini_bologna_2005]). The jet is even visible in the UV, optical and near-infrared [floyd_jet_2006]. Furthermore, the nuclear region of the heavily disturbed galaxy is obscured by several dust lanes roughly in the north-south directions [martel_hubble_1999]. The first ground-based MIR observations of 3C 293 were performed with IRTF, resulting in a tentative detection of nuclear emission [elvis_1-20_1984, impey_infrared_1990]. Later, the object was followed up with ISO/ISOCAM [siebenmorgen_isocam_2004] and Spitzer/IRAC, IRS and MIPS observations. In addition to a compact nucleus, flattened host galaxy emission with a diameter of ~ 14 kpc is visible in the IRAC and MIPS images. Our nuclear MIPS 24 μm flux agrees with [dicken_origin_2010]. The IRS LR staring-mode spectrum is dominated by strong PAH emission and silicate 10 μm absorption and has a rather flat spectral slope in νFν-space (see also [shi_aromatic_2007, leipski_spitzer_2009, ogle_jet-powered_2010, dicken_spitzer_2012]). Thus, the arcsecond-scale MIR SED is star-formation dominated. 3C 293 remained undetected in our COMICS N11.7 imaging observations in 2009. The derived upper limit on the nuclear N11.7 flux is ~ 87% lower than the Spitzer spectrophotometry. Therefore, the dominating star formation must be extended and is mostly resolved out at subarcsecond resolution, while any AGN contribution to the MIR emission of 3C 293 has to be small.
- [akujor_two-sided_1996] Chidi E. Akujor, J. P. Leahy, S. T. Garrington, H. Sanghera, R. E. Spencer, and R. T. Schilizzi. A two-sided jet structure in the `steep-spectrum core' of 3C293 . MNRAS , 278 pp. 1–5, January 1996.
- [beswick_high-resolution_2004] R. J. Beswick, A. B. Peck, G. B. Taylor, and G. Giovannini. High-resolution imaging of the radio continuum and neutral gas in the inner kiloparsec of the radio galaxy 3C 293 . MNRAS , 352 pp. 49–60, July 2004.
- [dicken_origin_2010] D. Dicken, C. Tadhunter, D. Axon, A. Robinson, R. Morganti, and P. Kharb. The origin of the infrared emission in radio galaxies. III. analysis of 3CRR objects . ApJ , 722 pp. 1333–1341, October 2010.
- [dicken_spitzer_2012] D. Dicken, C. Tadhunter, D. Axon, R. Morganti, A. Robinson, M. B. N. Kouwenhoven, H. Spoon, P. Kharb, K. J. Inskip, J. Holt, C. Ramos Almeida, and N. P. H. Nesvadba. Spitzer mid-IR spectroscopy of powerful 2 jy and 3CRR radio galaxies. i. evidence against a strong starburst-AGN connection in radio-loud AGN . ApJ , 745 pp. 172, February 2012.
- [elvis_1-20_1984] M. Elvis, S. P. Willner, G. Fabbiano, N. P. Carleton, A. Lawrence, and M. Ward. 1-20 micron infrared photometry of 3CR radio galaxies . ApJ , 280 pp. 574–579, May 1984.
- [floyd_jet_2006] David J. E. Floyd, Eric Perlman, J. Patrick Leahy, R. J. Beswick, Neal J. Jackson, William B. Sparks, David J. Axon, and Christopher P. O'Dea. The jet and circumnuclear environment of 3C 293 . ApJ , 639 pp. 23–36, March 2006.
- [giovannini_bologna_2005] G. Giovannini, G. B. Taylor, L. Feretti, W. D. Cotton, L. Lara, and T. Venturi. The bologna complete sample of nearby radio sources . ApJ , 618 pp. 635–648, January 2005.
- [impey_infrared_1990] C. D. Impey, C. G. Wynn-Williams, and E. E. Becklin. Infrared studies of elliptical galaxies. II - a radio-selected sample . ApJ , 356 pp. 62–74, June 1990.
- [leipski_spitzer_2009] C. Leipski, R. Antonucci, P. Ogle, and D. Whysong. The spitzer view of FR i radio galaxies: On the origin of the nuclear mid-infrared continuum . ApJ , 701 pp. 891–914, August 2009.
- [martel_hubble_1999] André R. Martel, Stefi A. Baum, William B. Sparks, Eric Wyckoff, John A. Biretta, Daniel Golombek, Ferdinando D. Macchetto, Sigrid de Koff, Patrick J. McCarthy, and George K. Miley. Hubble space telescope snapshot survey of 3CR radio source counterparts. III. radio galaxies with z<0.1 . ApJS , 122 pp. 81–108, May 1999.
- [ogle_jet-powered_2010] Patrick Ogle, Francois Boulanger, Pierre Guillard, Daniel A. Evans, Robert Antonucci, P. N. Appleton, Nicole Nesvadba, and Christian Leipski. Jet-powered molecular hydrogen emission from radio galaxies . ApJ , 724 pp. 1193–1217, December 2010.
- [shi_aromatic_2007] Yong Shi, Patrick Ogle, George H. Rieke, Robert Antonucci, Dean C. Hines, Paul S. Smith, Frank J. Low, Jeroen Bouwman, and Christopher Willmer. Aromatic features in AGNs: star-forming infrared luminosity function of AGN host galaxies . ApJ , 669 pp. 841–861, November 2007.
- [siebenmorgen_isocam_2004] R. Siebenmorgen, W. Freudling, E. Krügel, and M. Haas. ISOCAM survey and dust models of 3CR radio galaxies and quasars . A&A , 421 pp. 129–145, July 2004.
- [veron-cetty_catalogue_2010] M.-P. Véron-Cetty and P. Véron. A catalogue of quasars and active nuclei: 13th edition . A&A , 518 pp. 10, July 2010.
Images
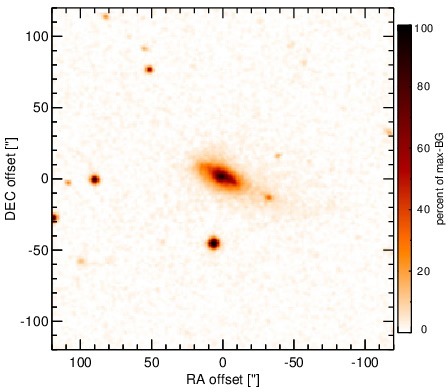
Optical image (DSS, red filter). Displayed are the central 4 arcmin with North being up and East to the left. The colour scaling is linear with white corresponding to the median background (BG) and black to the 0.01% pixels with the highest intensity.
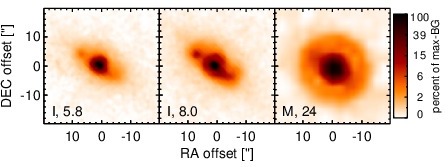
Spitzer MIR images. Displayed are the inner 40 arcsec with North being up and East to the left. The colour scaling is logarithmic with white corresponding to median BG and black to the 0.1% pixels with the highest intensity. The label in the bottom left states instrument and central wavelength of the filter in micron (I: IRAC, M: MIPS).
SEDs
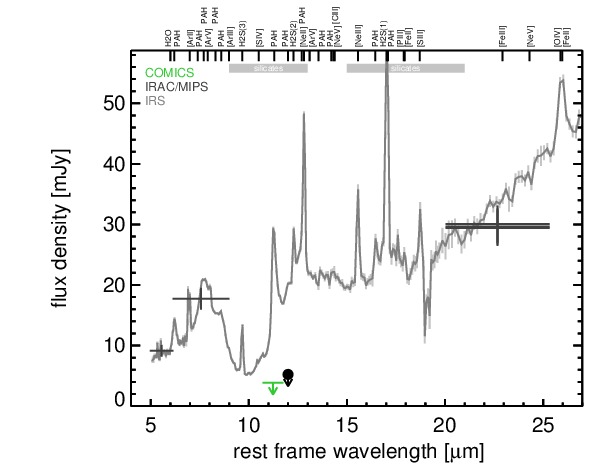
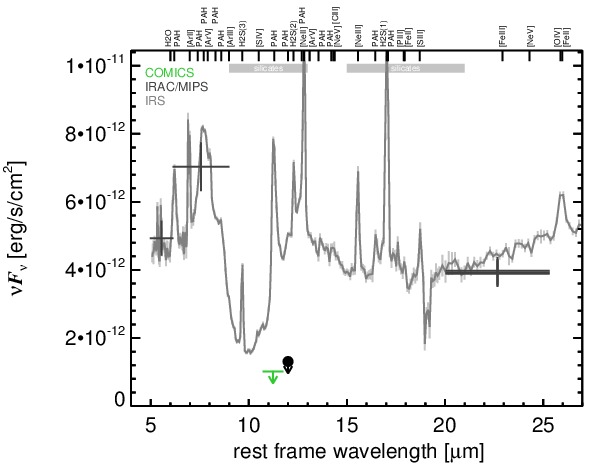
MIR SED. The description of the symbols in all the SED plots (where present) is the following: Grey crosses and solid lines mark the Spitzer/IRAC, MIPS and IRS data. The colour coding of the other symbols is as follows: green for COMICS, magenta for Michelle, blue for T-ReCS and red for VISIR data. Darker-coloured solid lines mark spectra of the corresponding instrument. The black filled circles mark the nuclear 12 and 18 micron continuum emission estimate from the data (where present). The ticks on the top axis mark positions of common MIR emission lines, while the light grey horizontal bars mark wavelength ranges affected by the silicate 10 and 18 micron features.