Sasmirala Individual Information for 3C 305
Description
3C 305 is a steep-spectrum FR I radio source coinciding with the peculiar galaxy IC 1065 at a redshift of z = 0.0416 (D ~ 192 Mpc) and a radio-loud Sy 2 nucleus [veron-cetty_catalogue_2010]. It possesses a compact radio morphology with both FR I and FR II characteristics, featuring a two-sided jet extending along a north-east axis to the biconical radio lobes, which are separated by ~ 4arcsec ~ 3.4 kpc (PA~ 54∘; [heckman_optical_1982, jackson_observations_2003]). The first successful MIR N-band observation was performed with ISO/ISOCAM [siebenmorgen_isocam_2004] and followed up with Spitzer/IRAC, IRS and MIPS observations. The corresponding images show a compact nucleus embedded within elliptically shaped host emission. In addition, a compact source of unknown nature us visible ~ 10arcsec ~ 8.6 kpc to the west (PA~ 243∘; 2MASS J14492029+6316107). Our nuclear MIPS 24 μm flux agrees with [dicken_origin_2010]. The IRS LR mapping-mode spectrum suffers from low S/N but indicates silicate 10 μm absorption and possible PAH emission. A better S/N IRS spectrum is shown in [dicken_spitzer_2012] with the same spectral features indicating star formation. 3C 305 remained undetected in our COMICS imaging observations of 2009 in the N11.7 filter. The resulting upper limit on the nuclear N11.7 flux is ~ 80% lower than the Spitzer spectrophotometry. Therefore, the arcsecond-scale MIR SED is completely dominated by star formation, which is resolved out at subarcsecond resolution, leaving little room for significant MIR emission from the AGN.
- [dicken_origin_2010] D. Dicken, C. Tadhunter, D. Axon, A. Robinson, R. Morganti, and P. Kharb. The origin of the infrared emission in radio galaxies. III. analysis of 3CRR objects . ApJ , 722 pp. 1333–1341, October 2010.
- [dicken_spitzer_2012] D. Dicken, C. Tadhunter, D. Axon, R. Morganti, A. Robinson, M. B. N. Kouwenhoven, H. Spoon, P. Kharb, K. J. Inskip, J. Holt, C. Ramos Almeida, and N. P. H. Nesvadba. Spitzer mid-IR spectroscopy of powerful 2 jy and 3CRR radio galaxies. i. evidence against a strong starburst-AGN connection in radio-loud AGN . ApJ , 745 pp. 172, February 2012.
- [heckman_optical_1982] T. M. Heckman, G. K. Miley, B. Balick, W. J. M. van Breugel, and H. R. Butcher. An optical and radio investigation of the radio galaxy 3C 305 . ApJ , 262 pp. 529–553, November 1982.
- [jackson_observations_2003] N. Jackson, R. Beswick, A. Pedlar, G. H. Cole, W. B. Sparks, J. P. Leahy, D. J. Axon, and A. J. Holloway. Observations of the neutral gas and dust in the radio galaxy 3C 305 . MNRAS , 338 pp. 643–654, January 2003.
- [siebenmorgen_isocam_2004] R. Siebenmorgen, W. Freudling, E. Krügel, and M. Haas. ISOCAM survey and dust models of 3CR radio galaxies and quasars . A&A , 421 pp. 129–145, July 2004.
- [veron-cetty_catalogue_2010] M.-P. Véron-Cetty and P. Véron. A catalogue of quasars and active nuclei: 13th edition . A&A , 518 pp. 10, July 2010.
Images
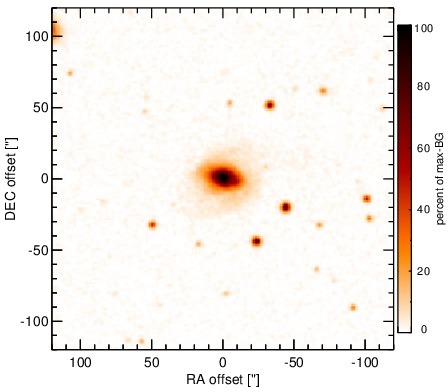
Optical image (DSS, red filter). Displayed are the central 4 arcmin with North being up and East to the left. The colour scaling is linear with white corresponding to the median background (BG) and black to the 0.01% pixels with the highest intensity.
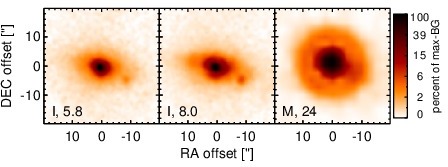
Spitzer MIR images. Displayed are the inner 40 arcsec with North being up and East to the left. The colour scaling is logarithmic with white corresponding to median BG and black to the 0.1% pixels with the highest intensity. The label in the bottom left states instrument and central wavelength of the filter in micron (I: IRAC, M: MIPS).
SEDs
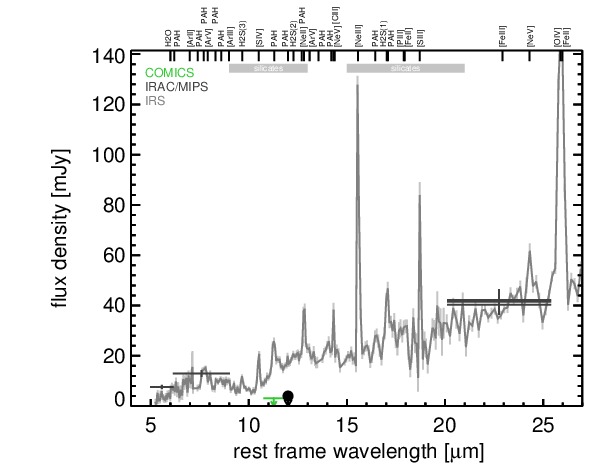
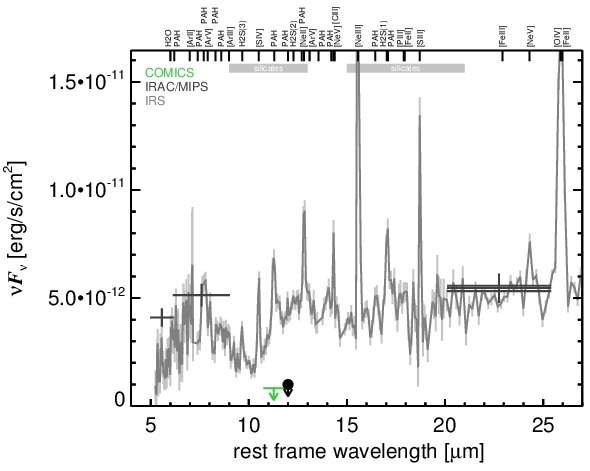
MIR SED. The description of the symbols in all the SED plots (where present) is the following: Grey crosses and solid lines mark the Spitzer/IRAC, MIPS and IRS data. The colour coding of the other symbols is as follows: green for COMICS, magenta for Michelle, blue for T-ReCS and red for VISIR data. Darker-coloured solid lines mark spectra of the corresponding instrument. The black filled circles mark the nuclear 12 and 18 micron continuum emission estimate from the data (where present). The ticks on the top axis mark positions of common MIR emission lines, while the light grey horizontal bars mark wavelength ranges affected by the silicate 10 and 18 micron features.