Sasmirala Individual Information for 3C 317
Description
3C 317 is an ultra-steep spectrum FR I radio source in the early-type galaxy UGC 9799 at a redshift of z = 0.0345 (D ~ 160 Mpc), the central galaxy of the cluster Abell 2052. It contains a radio-loud AGN, optically classified either as Sy 2 [veron-cetty_catalogue_2010] or LINER [simpson_emission-line_1996]. Instead of twin jets or lobes, 3C 317 displays an amorphous radio structure with a bright core [zhao_3c_1993]. At parsec-scales, a young radio source is found in the nucleus, suggestive of recently-restarted activity [venturi_radio_2004]. The first successful MIR observations of 3C 285 were performed with Spitzer/IRAC, IRS and MIPS, and the corresponding images show a compact nucleus embedded within diffuse elliptical host emission (see also [quillen_infrared_2008]). In addition, a compact source was detected at a distance of ~ 7arcsec north-east of the nucleus. It corresponds to the galaxy SDSS J151644.80+070123.3 and X-ray source EXSS 1514.2+0712. Our nuclear IRAC and MIPS fluxes are lower than those published in [quillen_infrared_2008] because they used an aperture of 12.2arcsec. The IRS LR staring-mode spectrum does not exhibit any significant silicate or PAH features and has a shallow blue spectral slope in νFν-space (see also [leipski_spitzer_2009, ogle_jet-powered_2010]). VISIR imaging of 3C 317 in the SIC filter was performed in 2006 but the nucleus remained undetected [van_der_wolk_dust_2010]. Our corresponding upper limit on the nuclear SIC flux is several times higher than that given by [van_der_wolk_dust_2010]. However, the most constraining upper limit is given by the Spitzer spectrophotometry. We, thus, use this for the upper limit of the nuclear 12 μm continuum emission of 3C 317.
- [leipski_spitzer_2009] C. Leipski, R. Antonucci, P. Ogle, and D. Whysong. The spitzer view of FR i radio galaxies: On the origin of the nuclear mid-infrared continuum . ApJ , 701 pp. 891–914, August 2009.
- [ogle_jet-powered_2010] Patrick Ogle, Francois Boulanger, Pierre Guillard, Daniel A. Evans, Robert Antonucci, P. N. Appleton, Nicole Nesvadba, and Christian Leipski. Jet-powered molecular hydrogen emission from radio galaxies . ApJ , 724 pp. 1193–1217, December 2010.
- [quillen_infrared_2008] Alice C. Quillen, Nicholas Zufelt, Jaehong Park, Christopher P. O'Dea, Stefi A. Baum, George Privon, Jacob Noel-Storr, Alastair Edge, Helen Russell, Andy Fabian, Megan Donahue, Joel N. Bregman, Brian R. McNamara, and Craig L. Sarazin. An infrared survey of brightest cluster galaxies. i. . ApJS , 176 pp. 39–58, May 2008.
- [simpson_emission-line_1996] C. Simpson, M. Ward, D. L. Clements, and S. Rawlings. Emission-line ratios in a radio-selected sample of active galactic nuclei. . MNRAS , 281 pp. 509–521, July 1996.
- [van_der_wolk_dust_2010] G. van der Wolk, P. D. Barthel, R. F. Peletier, and J. W. Pel. Dust tori in radio galaxies . A&A , 511 pp. 64, February 2010.
- [venturi_radio_2004] T. Venturi, D. Dallacasa, and F. Stefanachi. Radio galaxies in cooling core clusters. renewed activity in the nucleus of 3C 317? . A&A , 422 pp. 515–522, August 2004.
- [veron-cetty_catalogue_2010] M.-P. Véron-Cetty and P. Véron. A catalogue of quasars and active nuclei: 13th edition . A&A , 518 pp. 10, July 2010.
- [zhao_3c_1993] Jun-Hui Zhao, Dean M. Sumi, J. O. Burns, and Nebojsa Duric. 3C 317: an amorphous radio source in the cooling flow cluster abell 2052 . ApJ , 416 pp. 51, October 1993.
Images
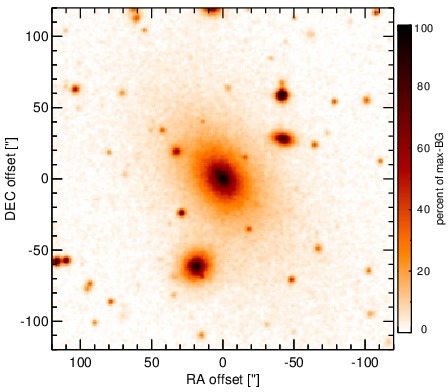
Optical image (DSS, red filter). Displayed are the central 4 arcmin with North being up and East to the left. The colour scaling is linear with white corresponding to the median background (BG) and black to the 0.01% pixels with the highest intensity.
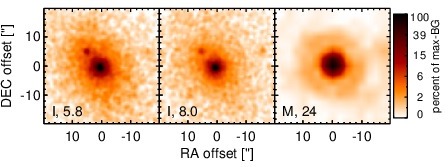
Spitzer MIR images. Displayed are the inner 40 arcsec with North being up and East to the left. The colour scaling is logarithmic with white corresponding to median BG and black to the 0.1% pixels with the highest intensity. The label in the bottom left states instrument and central wavelength of the filter in micron (I: IRAC, M: MIPS).
SEDs
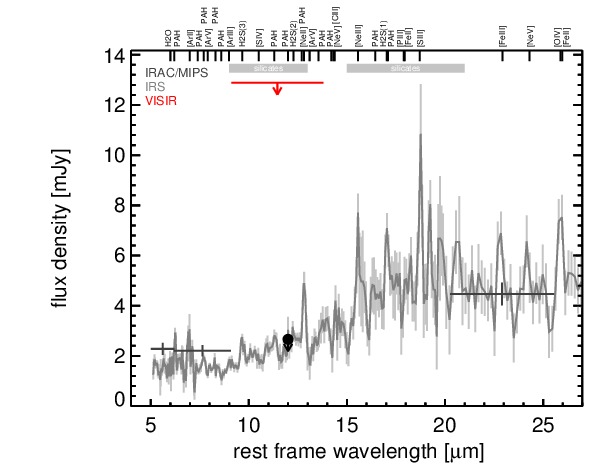
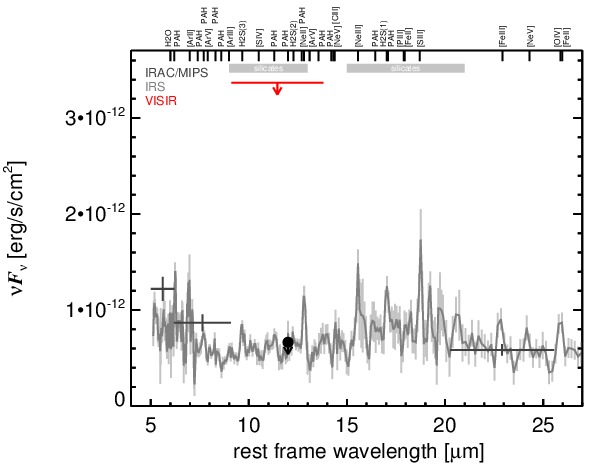
MIR SED. The description of the symbols in all the SED plots (where present) is the following: Grey crosses and solid lines mark the Spitzer/IRAC, MIPS and IRS data. The colour coding of the other symbols is as follows: green for COMICS, magenta for Michelle, blue for T-ReCS and red for VISIR data. Darker-coloured solid lines mark spectra of the corresponding instrument. The black filled circles mark the nuclear 12 and 18 micron continuum emission estimate from the data (where present). The ticks on the top axis mark positions of common MIR emission lines, while the light grey horizontal bars mark wavelength ranges affected by the silicate 10 and 18 micron features.