Sasmirala Individual Information for 3C 321
Description
3C 321 is a FR II radio source coinciding with the peculiar galaxy LEDA 55317 at a redshift of z = 0.0961 (D ~ 460 Mpc). It contains two apparent nuclei at optical wavelengths with a projected nuclear separation of ~ 3.5arcsec (~ 6.5 kpc) in the south-east direction (PA~-54∘; [roche_optical/ultraviolet_2000]). Note that, in addition, there is a foreground star ~ 12arcsec to the north of the system. The compact radio nucleus can be associated with the south-eastern component [baum_extended_1988], which is obscured by a dust lane along a north-eastern axis in the optical (PA~ 60∘; [hurt_ultraviolet_1999, martel_hubble_1999]. It is optically classified as a Sy 2 [filippenko_gravitational_1987] and exhibits polarized broad emission lines [young_scattered_1996]. It is unclear, whether the north-western component is another galaxy with its own AGN, as argued by [filippenko_gravitational_1987], [roche_optical/ultraviolet_2000] and [evans_radio_2008], or if the two apparent nuclei are in fact scattered light originating from a true nucleus in between them, as argued by [draper_optical_1993], [young_scattered_1996] and [hurt_ultraviolet_1999]. 3C 321 features supergalactic scale radio lobes along the north-west axis separated by ~ 500 kpc with a jet emanating from the south-eastern nucleus to the north-western radio hot spot (PA~-45∘; e.g., [leahy_bridges_1984, baum_extended_1988]).
The first successful MIR N-band observation was with ISOCAM [siebenmorgen_isocam_2004]. Spitzer/IRAC IRS and MIPS observations followed. 3C 321 appears only marginally resolved in the IRAC 5.8 and 8.0 μm and MIPS 24 μm images with the compact south-eastern nucleus dominating and a slight extension towards the north-western nucleus, parallel to the jet axis. Our nuclear MIPS 24 μm photometry agrees with the value published in [dicken_origin_2010]. The IRS LR staring spectrum shows strong silicate 10 μm absorption, very weak PAH emission, strong forbidden high-ionization lines, and a red spectral slope in νFν-space (see also [haas_spitzer_2005, shi_aromatic_2007]). Therefore, star formation appears to be weak in the central few kiloparsecs of 3C 321, which would be atypical for a galaxy merger. We observed 3C 321 with COMICS in the N11.7 filter in 2009 and weakly detected one compact nucleus, which appears slightly elongated (PA~ 90∘; FWHM ~ 1.3 kpc). However, without at least a second epoch of deep subarcsecond MIR imaging this extension remains unverified. We identify the detected nucleus with the south-eastern component, which is also dominating the Spitzer data. The corresponding nuclear N11.7 flux matches the Spitzer spectrophotometry, but it would be significantly lower if the presence of subarcsecond-extended emission can be verified. For now, the IRS spectrum is used to compute the nuclear 12 μm continuum emission estimate corrected for the silicate absorption feature. The resulting flux is then scaled by half of the ratio between FνPSF and FνGau to account for the possible nuclear extension. No sign of the north-western nucleus was detected in the COMICS image, which, therefore, has to be at least two times fainter.
- [baum_extended_1988] Stefi Alison Baum, Timothy M. Heckman, Alan Bridle, Wil J. M. van Breugel, and George K. Miley. Extended optical-line-emitting gas in radio galaxies - broad-band optical, narrow-band optical, and radio imaging of a representative sample . ApJS , 68 pp. 643–714, December 1988.
- [dicken_origin_2010] D. Dicken, C. Tadhunter, D. Axon, A. Robinson, R. Morganti, and P. Kharb. The origin of the infrared emission in radio galaxies. III. analysis of 3CRR objects . ApJ , 722 pp. 1333–1341, October 2010.
- [draper_optical_1993] P. W. Draper, S. M. Scarrott, and C. N. Tadhunter. The optical polarization of the low-redshift radio galaxies 3CR 33,305, 321 and 459 . MNRAS , 262 pp. 1029–1036, June 1993.
- [evans_radio_2008] Daniel A. Evans, Wen-Fai Fong, Martin J. Hardcastle, Ralph P. Kraft, Julia C. Lee, Diana M. Worrall, Mark Birkinshaw, Judith H. Croston, and Tom W. B. Muxlow. A radio through x-ray study of the Jet/Companion-Galaxy interaction in 3C 321 . ApJ , 675 pp. 1057–1066, March 2008.
- [filippenko_gravitational_1987] A. V. Filippenko. The 'gravitational lens' 3C 321 : a remarkable impostor. . In Observational Cosmology , volume 124 of Proc. IAU Symp. , pages 751–754, 1987.
- [haas_spitzer_2005] M. Haas, R. Siebenmorgen, B. Schulz, E. Krügel, and R. Chini. Spitzer IRS spectroscopy of 3CR radio galaxies and quasars: testing the unified schemes . A&A , 442 pp. L39–L43, November 2005.
- [hurt_ultraviolet_1999] Todd Hurt, Robert Antonucci, Ross Cohen, Anne Kinney, and Julian Krolik. Ultraviolet imaging polarimetry of narrow-line radio galaxies . ApJ , 514 pp. 579–586, April 1999.
- [leahy_bridges_1984] J. P. Leahy and A. G. Williams. The bridges of classical double radio sources . MNRAS , 210 pp. 929–951, October 1984.
- [martel_hubble_1999] André R. Martel, Stefi A. Baum, William B. Sparks, Eric Wyckoff, John A. Biretta, Daniel Golombek, Ferdinando D. Macchetto, Sigrid de Koff, Patrick J. McCarthy, and George K. Miley. Hubble space telescope snapshot survey of 3CR radio source counterparts. III. radio galaxies with z<0.1 . ApJS , 122 pp. 81–108, May 1999.
- [roche_optical/ultraviolet_2000] Nathan Roche and Stephen A. Eales. Optical/ultraviolet morphology and alignment of low-redshift radio galaxies . MNRAS , 317 pp. 120–140, September 2000.
- [shi_aromatic_2007] Yong Shi, Patrick Ogle, George H. Rieke, Robert Antonucci, Dean C. Hines, Paul S. Smith, Frank J. Low, Jeroen Bouwman, and Christopher Willmer. Aromatic features in AGNs: star-forming infrared luminosity function of AGN host galaxies . ApJ , 669 pp. 841–861, November 2007.
- [siebenmorgen_isocam_2004] R. Siebenmorgen, W. Freudling, E. Krügel, and M. Haas. ISOCAM survey and dust models of 3CR radio galaxies and quasars . A&A , 421 pp. 129–145, July 2004.
- [young_scattered_1996] S. Young, J. H. Hough, A. Efstathiou, B. J. Wills, D. J. Axon, J. A. Bailey, and M. J. Ward. Scattered broad optical lines in the polarized flux spectrum of the FR II galaxy 3C 321. . MNRAS , 279 pp. L72–L76, April 1996.
Images
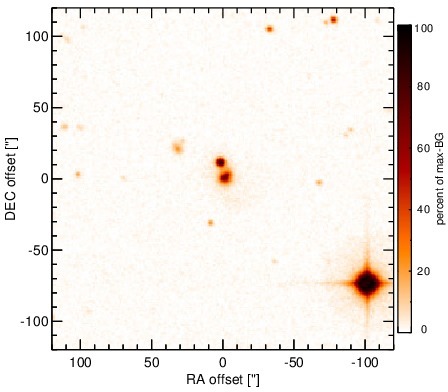
Optical image (DSS, red filter). Displayed are the central 4 arcmin with North being up and East to the left. The colour scaling is linear with white corresponding to the median background (BG) and black to the 0.01% pixels with the highest intensity.
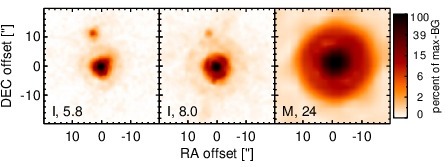
Spitzer MIR images. Displayed are the inner 40 arcsec with North being up and East to the left. The colour scaling is logarithmic with white corresponding to median BG and black to the 0.1% pixels with the highest intensity. The label in the bottom left states instrument and central wavelength of the filter in micron (I: IRAC, M: MIPS).
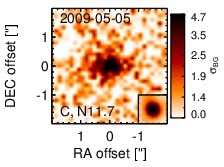
Subarcsecond-resolution MIR images sorted by increasing filter central wavelength. Displayed are the inner 4 arcsec with North being up and East to the left. The colour scaling is logarithmic with white corresponding to median BG and black to the 75% of the highest intensity of all images in units of sig_bg. The inset image (where present; either bottom or top right) shows the central arcsecond of the PSF from the calibrator star, scaled to match the science target. The labels in the bottom left state instrument and filter names (C: COMICS, M: Michelle, T: T-ReCS, V: VISIR).
SEDs
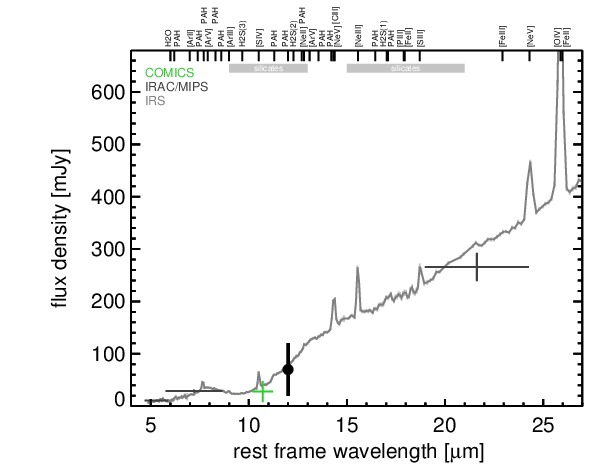
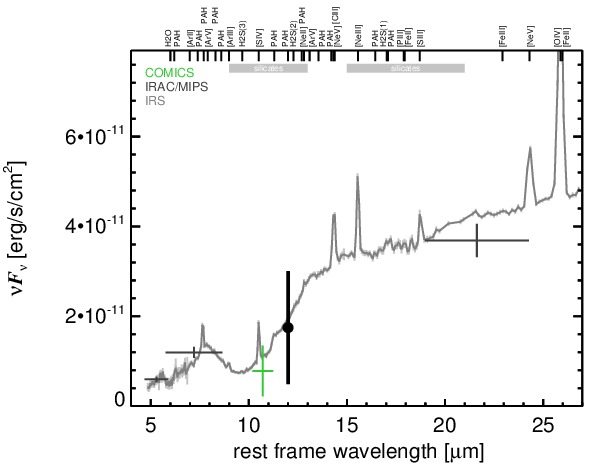
MIR SED. The description of the symbols in all the SED plots (where present) is the following: Grey crosses and solid lines mark the Spitzer/IRAC, MIPS and IRS data. The colour coding of the other symbols is as follows: green for COMICS, magenta for Michelle, blue for T-ReCS and red for VISIR data. Darker-coloured solid lines mark spectra of the corresponding instrument. The black filled circles mark the nuclear 12 and 18 micron continuum emission estimate from the data (where present). The ticks on the top axis mark positions of common MIR emission lines, while the light grey horizontal bars mark wavelength ranges affected by the silicate 10 and 18 micron features.