Sasmirala Individual Information for 3C 33
Description
3C 33 is a FR II radio object identified with the galaxy LEDA 4088 at a redshift of z = 0.0597 (D ~ 273 Mpc). It hosts a Sy 2 AGN [koski_spectrophotometry_1978] with detected polarized broad lines [cohen_polarimetry_1999]. It is also an X-ray “buried” AGN candidate [noguchi_new_2009]. 3C 33 features classical FR II supergalactic-scale radio lobes in the north-south directions with two symmetrical jets being visible also at parsec scales (PA~ 20∘; e.g., [leahy_vla_1991, giovannini_bologna_2005]). Spitzer/IRAC, IRS and MIPS data are available for this source. It appears as a MIR point source in the IRAC 5.8 and 8.0 μm and MIPS 24 μm images. Our nuclear MIPS 24 μm photometry provides a flux consistent with [dicken_origin_2010]. The IRS LR staring-mode spectrum exhibits weak silicate 10 μm absorption, weak PAH emission and strong forbidden emission lines (see also [ogle_spitzer_2006]). The red MIR continuum peaks at around 20 μm and is attributed to thermal dust emission by [ogle_spitzer_2006]. We observed 3C 33 with COMICS in the N11.7 filter in 2009 and weakly detected a compact nucleus, which appears to be marginally resolved (FWHM~ 0.92arcsec ~ 1 kpc). However, at least a second epoch of deep subarcsecond MIR imaging is required to confirm this extension. The nuclear COMICS photometric flux agrees with the Spitzer spectrophotometry, but it would be significantly lower if the presence of subarcsecond-extended emission can be verified.
- [cohen_polarimetry_1999] Marshall H. Cohen, Patrick M. Ogle, Hien D. Tran, Robert W. Goodrich, and Joseph S. Miller. Polarimetry and unification of low-redshift radio galaxies . AJ , 118 pp. 1963–1987, November 1999.
- [dicken_origin_2010] D. Dicken, C. Tadhunter, D. Axon, A. Robinson, R. Morganti, and P. Kharb. The origin of the infrared emission in radio galaxies. III. analysis of 3CRR objects . ApJ , 722 pp. 1333–1341, October 2010.
- [giovannini_bologna_2005] G. Giovannini, G. B. Taylor, L. Feretti, W. D. Cotton, L. Lara, and T. Venturi. The bologna complete sample of nearby radio sources . ApJ , 618 pp. 635–648, January 2005.
- [koski_spectrophotometry_1978] A. T. Koski. Spectrophotometry of seyfert 2 galaxies and narrow-line radio galaxies . ApJ , 223 pp. 56–73, July 1978.
- [leahy_vla_1991] J. P. Leahy and R. A. Perley. VLA images of 23 extragalactic radio sources . AJ , 102 pp. 537–561, August 1991.
- [noguchi_new_2009] Kazuhisa Noguchi, Yuichi Terashima, and Hisamitsu Awaki. A new sample of buried active galactic nuclei selected from the second XMM-Newton serendipitous source catalogue . ApJ , 705 pp. 454–467, November 2009.
- [ogle_spitzer_2006] Patrick Ogle, David Whysong, and Robert Antonucci. Spitzer reveals hidden quasar nuclei in some powerful FR II radio galaxies . ApJ , 647 pp. 161–171, August 2006.
Images
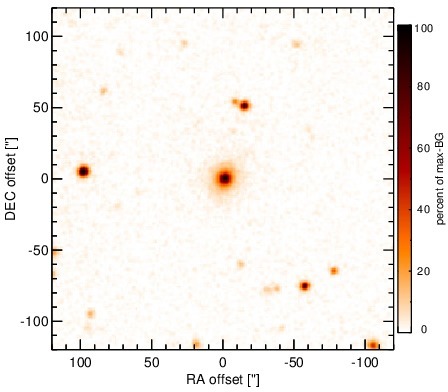
Optical image (DSS, red filter). Displayed are the central 4 arcmin with North being up and East to the left. The colour scaling is linear with white corresponding to the median background (BG) and black to the 0.01% pixels with the highest intensity.
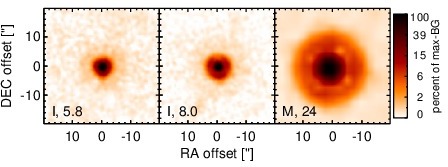
Spitzer MIR images. Displayed are the inner 40 arcsec with North being up and East to the left. The colour scaling is logarithmic with white corresponding to median BG and black to the 0.1% pixels with the highest intensity. The label in the bottom left states instrument and central wavelength of the filter in micron (I: IRAC, M: MIPS).
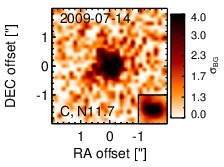
Subarcsecond-resolution MIR images sorted by increasing filter central wavelength. Displayed are the inner 4 arcsec with North being up and East to the left. The colour scaling is logarithmic with white corresponding to median BG and black to the 75% of the highest intensity of all images in units of sig_bg. The inset image (where present; either bottom or top right) shows the central arcsecond of the PSF from the calibrator star, scaled to match the science target. The labels in the bottom left state instrument and filter names (C: COMICS, M: Michelle, T: T-ReCS, V: VISIR).
SEDs
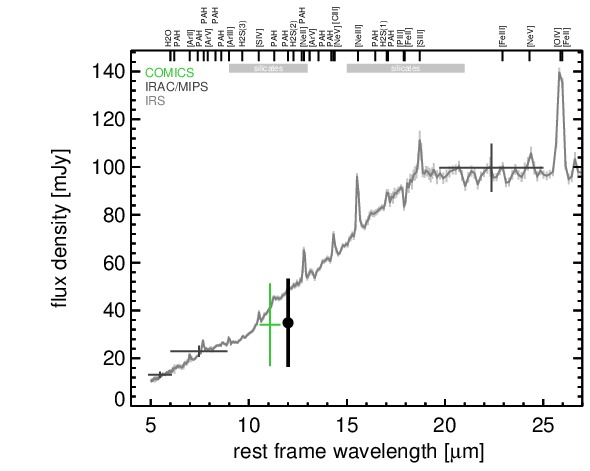
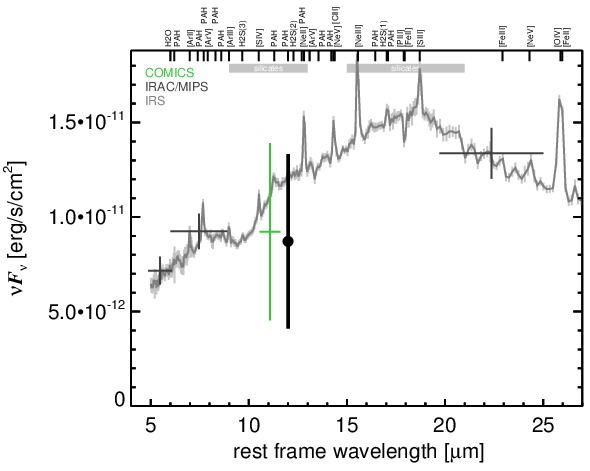
MIR SED. The description of the symbols in all the SED plots (where present) is the following: Grey crosses and solid lines mark the Spitzer/IRAC, MIPS and IRS data. The colour coding of the other symbols is as follows: green for COMICS, magenta for Michelle, blue for T-ReCS and red for VISIR data. Darker-coloured solid lines mark spectra of the corresponding instrument. The black filled circles mark the nuclear 12 and 18 micron continuum emission estimate from the data (where present). The ticks on the top axis mark positions of common MIR emission lines, while the light grey horizontal bars mark wavelength ranges affected by the silicate 10 and 18 micron features.