Sasmirala Individual Information for 3C 390.3
Description
3C 390.3 is a flat-spectrum FR II radio source identified with the elliptical galaxy VII Zw 838 [martel_hubble_1999] at a redshift of z = 0.0561 (D ~ 259 Mpc). It contains a variable AGN with optical Sy 1.5 classification [veron-cetty_catalogue_2010] and blazar characteristics that9 is also a member of the nine-month BAT AGN sample. 3C 390.3 features supergalactic-scale biconical radio lobes with a faint one-sided jet extending to the north-eastern lobe (PA~ 145∘; e.g., [leahy_jets_1995]). Early N-band imaging was performed with ISO [siebenmorgen_isocam_2004]. 3C 390.3 was also observed with Spitzer/IRAC, IRS and MIPS and remains nearly unresolved in all images. Our nuclear MIPS 24 μm photometry agrees with the value given in [dicken_origin_2010]. The IRS LR staring-mode spectrum shows silicate emission, only weak forbidden emission lines and an emission peak at ~ 19 μm in νFν-space but no PAH features (see also [shi_9.7_2006, mullaney_defining_2011]). We observed 3C 390.3 with COMICS in the N11.7 filter in 2009 and detected a compact source that appears to be resolved (FWHM ~ 0.5arcsec ~ 0.5 kpc). However, a second epoch of deep subarcsecond MIR imaging is required to verify this extension. Notably, the Spitzer flux levels are mismatched. The MIPS (24 μm) photometry and IRS spectrum from 2004 are lower than the IRAC (5.8 and 8.0 μm) photometry from 2008, providing one assumes a constant MIR SED shape. Therefore, 3C 390.3 appears to have increased its MIR emission in the last few years (similar to 3C 382; see also [edelson_far-infrared_1987]). For a better comparison with our COMICS N11.7 photometry, we scale the IRS spectrum according to the IRAC fluxes and find consistent flux levels between COMICS and Spitzer. This also indicates that the silicate emission arises in the subarcsecond-scale nucleus, and thus thermal dust must contribute significantly to the nuclear MIR emission. Therefore, we use the IRS spectrum to compute the nuclear 12 μm continuum emission estimate corrected for the silicate feature. Note however, that the nuclear flux would be ~ 50% lower than the Spitzer spectrophotometry if the presence of subarcsecond-extended emission can be verified. For now, the resulting synthetic flux is then scaled by half of the ratio between FνPSF and FνGau to account for the possibly nuclear extension.
- [dicken_origin_2010] D. Dicken, C. Tadhunter, D. Axon, A. Robinson, R. Morganti, and P. Kharb. The origin of the infrared emission in radio galaxies. III. analysis of 3CRR objects . ApJ , 722 pp. 1333–1341, October 2010.
- [edelson_far-infrared_1987] R. A. Edelson and M. A. Malkan. Far-infrared variability in active galactic nuclei . ApJ , 323 pp. 516–535, December 1987.
- [leahy_jets_1995] J. P. Leahy and R. A. Perley. The jets and hotspots of 3C 390.3 . MNRAS , 277 pp. 1097–1114, December 1995.
- [martel_hubble_1999] André R. Martel, Stefi A. Baum, William B. Sparks, Eric Wyckoff, John A. Biretta, Daniel Golombek, Ferdinando D. Macchetto, Sigrid de Koff, Patrick J. McCarthy, and George K. Miley. Hubble space telescope snapshot survey of 3CR radio source counterparts. III. radio galaxies with z<0.1 . ApJS , 122 pp. 81–108, May 1999.
- [mullaney_defining_2011] J. R. Mullaney, D. M. Alexander, A. D. Goulding, and R. C. Hickox. Defining the intrinsic AGN infrared spectral energy distribution and measuring its contribution to the infrared output of composite galaxies . MNRAS , page 474, April 2011.
- [shi_9.7_2006] Y. Shi, G. H. Rieke, D. C. Hines, V. Gorjian, M. W. Werner, K. Cleary, F. J. Low, P. S. Smith, and J. Bouwman. 9.7 μm silicate features in active galactic nuclei: New insights into unification models . ApJ , 653 pp. 127–136, December 2006.
- [siebenmorgen_isocam_2004] R. Siebenmorgen, W. Freudling, E. Krügel, and M. Haas. ISOCAM survey and dust models of 3CR radio galaxies and quasars . A&A , 421 pp. 129–145, July 2004.
- [veron-cetty_catalogue_2010] M.-P. Véron-Cetty and P. Véron. A catalogue of quasars and active nuclei: 13th edition . A&A , 518 pp. 10, July 2010.
Images
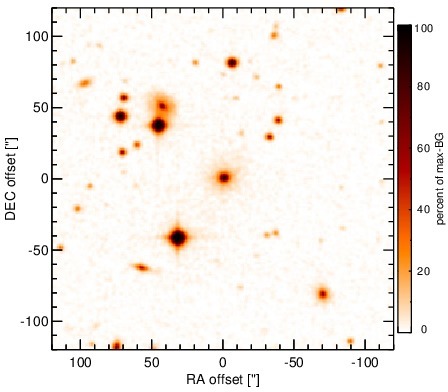
Optical image (DSS, red filter). Displayed are the central 4 arcmin with North being up and East to the left. The colour scaling is linear with white corresponding to the median background (BG) and black to the 0.01% pixels with the highest intensity.
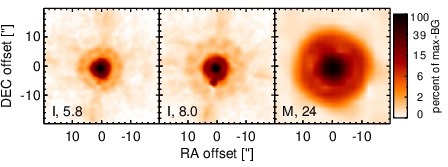
Spitzer MIR images. Displayed are the inner 40 arcsec with North being up and East to the left. The colour scaling is logarithmic with white corresponding to median BG and black to the 0.1% pixels with the highest intensity. The label in the bottom left states instrument and central wavelength of the filter in micron (I: IRAC, M: MIPS).
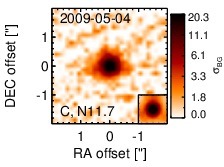
Subarcsecond-resolution MIR images sorted by increasing filter central wavelength. Displayed are the inner 4 arcsec with North being up and East to the left. The colour scaling is logarithmic with white corresponding to median BG and black to the 75% of the highest intensity of all images in units of sig_bg. The inset image (where present; either bottom or top right) shows the central arcsecond of the PSF from the calibrator star, scaled to match the science target. The labels in the bottom left state instrument and filter names (C: COMICS, M: Michelle, T: T-ReCS, V: VISIR).
SEDs
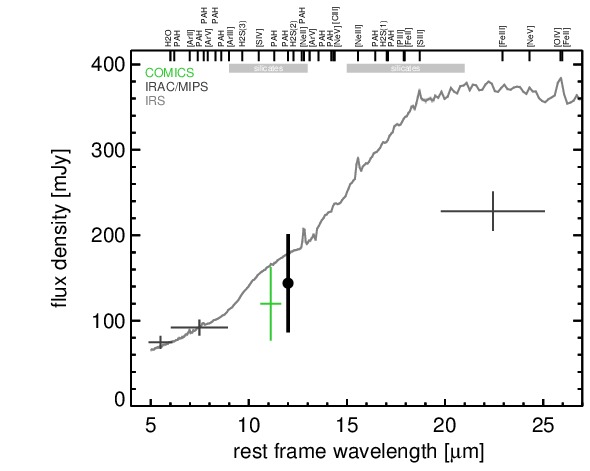
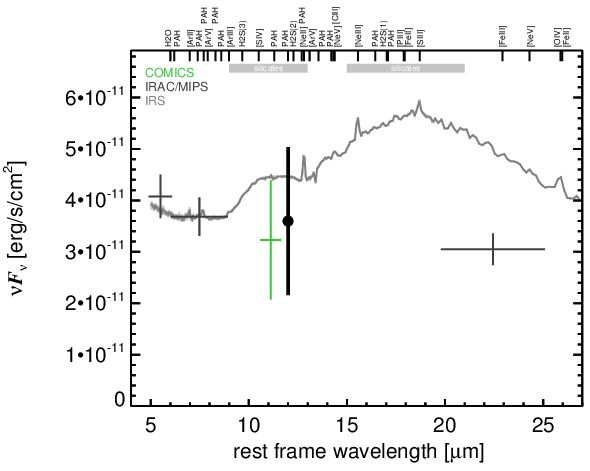
MIR SED. The description of the symbols in all the SED plots (where present) is the following: Grey crosses and solid lines mark the Spitzer/IRAC, MIPS and IRS data. The colour coding of the other symbols is as follows: green for COMICS, magenta for Michelle, blue for T-ReCS and red for VISIR data. Darker-coloured solid lines mark spectra of the corresponding instrument. The black filled circles mark the nuclear 12 and 18 micron continuum emission estimate from the data (where present). The ticks on the top axis mark positions of common MIR emission lines, while the light grey horizontal bars mark wavelength ranges affected by the silicate 10 and 18 micron features.