Sasmirala Individual Information for 3C 403
Description
3C 403 is a FR II radio source identified with the early-type galaxy LEDA 63758 [martel_hubble_1999] at a redshift of z = 0.059 (D ~ 271 Mpc) with a Sy 2 nucleus [veron-cetty_catalogue_2010]. It features a complex super-galactic-scale X-shaped radio morphology with a twin jet feeding biconical radio lobes (PA~ 70∘; e.g., [black_study_1992]), and a nuclear water mega-maser [tarchi_discovery_2003, tarchi_innermost_2007]. After first being detected in the MIR with IRAS, 3C 403 was followed up with Spitzer/IRAC, IRS and MIPS and is only marginally resolved in all images. Our nuclear MIPS (24 μm) photometry agrees with the value given in [dicken_origin_2008]. The IRS LR mapping-mode spectrum appears relatively featureless without significant silicate or PAH features but a curved red slope in νFν-space. A more carefully reduced version is published by [dicken_spitzer_2012] and shows weak silicate emission, unexpected for a type II AGN. [van_der_wolk_dust_2010] performed VISIR imaging of 3C 403 in the SIC filter in 2006 and detected a compact nucleus. The observations were not diffraction-limited. Thus, it remains unclear, whether the nucleus is resolved at subarcsecond resolution in the MIR. Our nuclear SIC flux is consistent with [van_der_wolk_dust_2010] and is ~ 10% lower than the Spitzer spectrophotometry.
- [black_study_1992] A. R. S. Black, S. A. Baum, J. P. Leahy, R. A. Perley, J. M. Riley, and P. A. G. Scheuer. A study of FRII radio galaxies with z less than 0.15. i - high-resolution maps of eight sources at 3.6 CM . MNRAS , 256 pp. 186–208, May 1992.
- [dicken_origin_2008] D. Dicken, C. Tadhunter, R. Morganti, C. Buchanan, T. Oosterloo, and D. Axon. The origin of the infrared emission in radio galaxies. i. new mid- to far-infrared and radio observations of the 2 jy sample . ApJ , 678 pp. 712–728, May 2008.
- [dicken_spitzer_2012] D. Dicken, C. Tadhunter, D. Axon, R. Morganti, A. Robinson, M. B. N. Kouwenhoven, H. Spoon, P. Kharb, K. J. Inskip, J. Holt, C. Ramos Almeida, and N. P. H. Nesvadba. Spitzer mid-IR spectroscopy of powerful 2 jy and 3CRR radio galaxies. i. evidence against a strong starburst-AGN connection in radio-loud AGN . ApJ , 745 pp. 172, February 2012.
- [martel_hubble_1999] André R. Martel, Stefi A. Baum, William B. Sparks, Eric Wyckoff, John A. Biretta, Daniel Golombek, Ferdinando D. Macchetto, Sigrid de Koff, Patrick J. McCarthy, and George K. Miley. Hubble space telescope snapshot survey of 3CR radio source counterparts. III. radio galaxies with z<0.1 . ApJS , 122 pp. 81–108, May 1999.
- [tarchi_discovery_2003] A. Tarchi, C. Henkel, M. Chiaberge, and K. M. Menten. Discovery of a luminous water megamaser in the FRII radiogalaxy 3C 403 . A&A , 407 pp. L33–L36, August 2003.
- [tarchi_innermost_2007] A. Tarchi, A. Brunthaler, C. Henkel, K. M. Menten, J. Braatz, and A. Weiß. The innermost region of the water megamaser radio galaxy 3C 403 . A&A , 475 pp. 497–506, November 2007.
- [van_der_wolk_dust_2010] G. van der Wolk, P. D. Barthel, R. F. Peletier, and J. W. Pel. Dust tori in radio galaxies . A&A , 511 pp. 64, February 2010.
- [veron-cetty_catalogue_2010] M.-P. Véron-Cetty and P. Véron. A catalogue of quasars and active nuclei: 13th edition . A&A , 518 pp. 10, July 2010.
Images
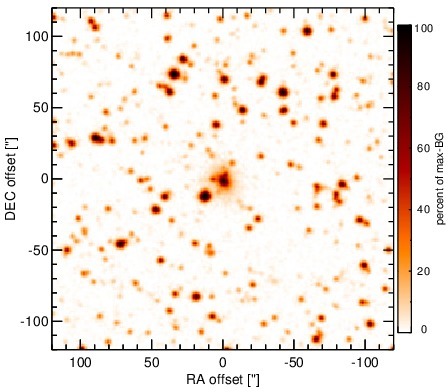
Optical image (DSS, red filter). Displayed are the central 4 arcmin with North being up and East to the left. The colour scaling is linear with white corresponding to the median background (BG) and black to the 0.01% pixels with the highest intensity.
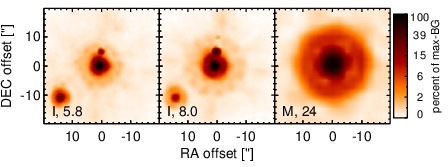
Spitzer MIR images. Displayed are the inner 40 arcsec with North being up and East to the left. The colour scaling is logarithmic with white corresponding to median BG and black to the 0.1% pixels with the highest intensity. The label in the bottom left states instrument and central wavelength of the filter in micron (I: IRAC, M: MIPS).
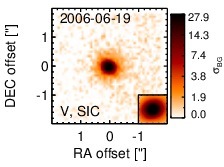
Subarcsecond-resolution MIR images sorted by increasing filter central wavelength. Displayed are the inner 4 arcsec with North being up and East to the left. The colour scaling is logarithmic with white corresponding to median BG and black to the 75% of the highest intensity of all images in units of sig_bg. The inset image (where present; either bottom or top right) shows the central arcsecond of the PSF from the calibrator star, scaled to match the science target. The labels in the bottom left state instrument and filter names (C: COMICS, M: Michelle, T: T-ReCS, V: VISIR).
SEDs

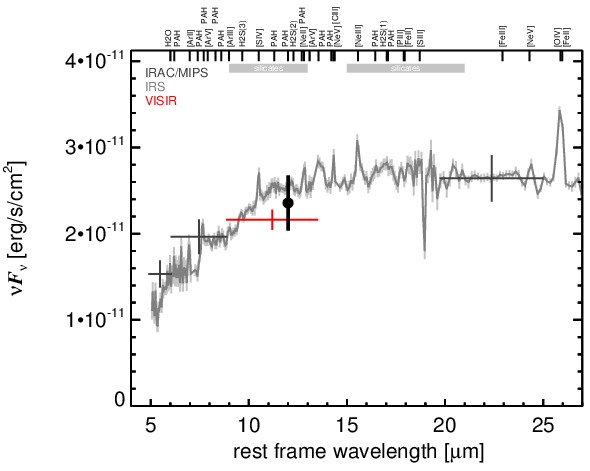
MIR SED. The description of the symbols in all the SED plots (where present) is the following: Grey crosses and solid lines mark the Spitzer/IRAC, MIPS and IRS data. The colour coding of the other symbols is as follows: green for COMICS, magenta for Michelle, blue for T-ReCS and red for VISIR data. Darker-coloured solid lines mark spectra of the corresponding instrument. The black filled circles mark the nuclear 12 and 18 micron continuum emission estimate from the data (where present). The ticks on the top axis mark positions of common MIR emission lines, while the light grey horizontal bars mark wavelength ranges affected by the silicate 10 and 18 micron features.