Sasmirala Individual Information for 3C 424
Description
3C 424 is a borderline FR I/II radio source identified with the early-type galaxy LEDA 65411 at a redshift of z = 0.127 (D ~ 613 Mpc) with a Sy 2 nucleus [veron-cetty_catalogue_2010]. It features an unusual super-galactic scale radio morphology with faint smooth lobes and faint jets along the north-south axis (PA~-25∘; e.g., [black_study_1992]). 3C 424 remained undetected in IRAS and appears as a weak point source in the first three WISE bands. It becomes increasingly fainter towards longer wavelengths and is not detected in the WISE band 4 (24 μm). The object was observed with Spitzer/IRS in LR staring-mode. The corresponding spectrum has a low S/N and appears featureless with a flat slope in νFν-space, except for H2 emission (see also [leipski_spitzer_2009, ogle_jet-powered_2010]). 3C 424 was observed with VISIR in the SIC filter in 2006 but no nucleus was detected [van_der_wolk_dust_2010]. Our corresponding upper limit on the nuclear flux is a factor of two higher than that given by [van_der_wolk_dust_2010]. However, the IRS spectrum consistent with the WISE band 3 flux provides the tightest constraint on the nuclear MIR emission and is thus also used to derive our 12 μm continuum emission estimate.
- [black_study_1992] A. R. S. Black, S. A. Baum, J. P. Leahy, R. A. Perley, J. M. Riley, and P. A. G. Scheuer. A study of FRII radio galaxies with z less than 0.15. i - high-resolution maps of eight sources at 3.6 CM . MNRAS , 256 pp. 186–208, May 1992.
- [leipski_spitzer_2009] C. Leipski, R. Antonucci, P. Ogle, and D. Whysong. The spitzer view of FR i radio galaxies: On the origin of the nuclear mid-infrared continuum . ApJ , 701 pp. 891–914, August 2009.
- [ogle_jet-powered_2010] Patrick Ogle, Francois Boulanger, Pierre Guillard, Daniel A. Evans, Robert Antonucci, P. N. Appleton, Nicole Nesvadba, and Christian Leipski. Jet-powered molecular hydrogen emission from radio galaxies . ApJ , 724 pp. 1193–1217, December 2010.
- [van_der_wolk_dust_2010] G. van der Wolk, P. D. Barthel, R. F. Peletier, and J. W. Pel. Dust tori in radio galaxies . A&A , 511 pp. 64, February 2010.
- [veron-cetty_catalogue_2010] M.-P. Véron-Cetty and P. Véron. A catalogue of quasars and active nuclei: 13th edition . A&A , 518 pp. 10, July 2010.
Images
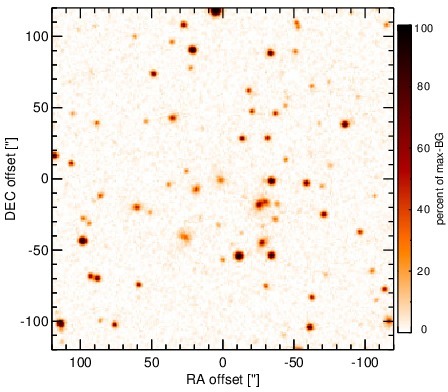
Optical image (DSS, red filter). Displayed are the central 4 arcmin with North being up and East to the left. The colour scaling is linear with white corresponding to the median background (BG) and black to the 0.01% pixels with the highest intensity.
SEDs
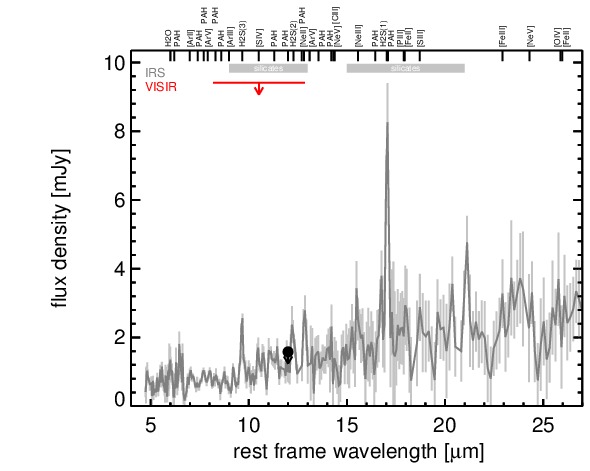
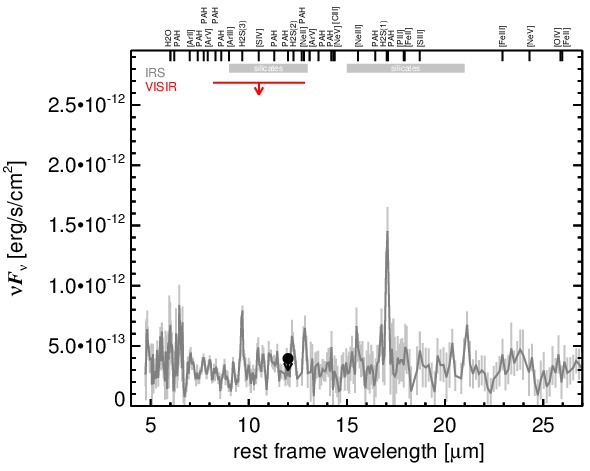
MIR SED. The description of the symbols in all the SED plots (where present) is the following: Grey crosses and solid lines mark the Spitzer/IRAC, MIPS and IRS data. The colour coding of the other symbols is as follows: green for COMICS, magenta for Michelle, blue for T-ReCS and red for VISIR data. Darker-coloured solid lines mark spectra of the corresponding instrument. The black filled circles mark the nuclear 12 and 18 micron continuum emission estimate from the data (where present). The ticks on the top axis mark positions of common MIR emission lines, while the light grey horizontal bars mark wavelength ranges affected by the silicate 10 and 18 micron features.