Sasmirala Individual Information for 3C 452
Description
3C 452 is a FR II radio source identified with the elliptical galaxy LEDA 69671 [martel_hubble_1999] at a redshift of z = 0.0811 (D ~ 378 Mpc). It contains an AGN with optical Sy 2 classification [veron-cetty_catalogue_2010] that belongs to the nine-month BAT AGN sample. The radio morphology is typical for a FR II source, with the supergalactic-scale biconical radio lobes connected to the nucleus by a twin jet along the east-west axis (PA~ 75∘; e.g., [black_study_1992]). Recently, even larger, megaparsec-scale fossil radio lobes have been discovered along the same projected axis, indicating recurrent AGN activity in 3C 452 [sirothia_discovery_2013]. Note that there is a foreground star ~ 12arcsec to the west of the galaxy. The first successful MIR observations of 3C 452 were performed with ISO/ISOCAM [siebenmorgen_isocam_2004]. These observations were later followed up with Spitzer/IRAC, IRS and MIPS. 3C 452 is nearly unresolved in all Spitzer images. Our nuclear MIPS 24 μm photometry agrees with the value published in [dicken_origin_2010]. The IRS LR staring-mode spectrum is relatively featureless with weak silicate 10 μm absorption and an emission peak at at ~ 19 μm in νFν-space but no PAH features [ogle_spitzer_2006]. Our COMICS N11.7 image taken in 2009 shows a weakly detected source with uncertain extension at subarcsecond scales. The photometric flux is ~ 30% higher than expected from the Spitzer data, albeit with a 20% uncertainty.
- [black_study_1992] A. R. S. Black, S. A. Baum, J. P. Leahy, R. A. Perley, J. M. Riley, and P. A. G. Scheuer. A study of FRII radio galaxies with z less than 0.15. i - high-resolution maps of eight sources at 3.6 CM . MNRAS , 256 pp. 186–208, May 1992.
- [dicken_origin_2010] D. Dicken, C. Tadhunter, D. Axon, A. Robinson, R. Morganti, and P. Kharb. The origin of the infrared emission in radio galaxies. III. analysis of 3CRR objects . ApJ , 722 pp. 1333–1341, October 2010.
- [martel_hubble_1999] André R. Martel, Stefi A. Baum, William B. Sparks, Eric Wyckoff, John A. Biretta, Daniel Golombek, Ferdinando D. Macchetto, Sigrid de Koff, Patrick J. McCarthy, and George K. Miley. Hubble space telescope snapshot survey of 3CR radio source counterparts. III. radio galaxies with z<0.1 . ApJS , 122 pp. 81–108, May 1999.
- [ogle_spitzer_2006] Patrick Ogle, David Whysong, and Robert Antonucci. Spitzer reveals hidden quasar nuclei in some powerful FR II radio galaxies . ApJ , 647 pp. 161–171, August 2006.
- [siebenmorgen_isocam_2004] R. Siebenmorgen, W. Freudling, E. Krügel, and M. Haas. ISOCAM survey and dust models of 3CR radio galaxies and quasars . A&A , 421 pp. 129–145, July 2004.
- [sirothia_discovery_2013] S. K. Sirothia, Gopal-Krishna, and Paul J. Wiita. Discovery of giant relic radio lobes straddling the classical double radio galaxy 3C452 . ApJL , 765 pp. L11, March 2013.
- [veron-cetty_catalogue_2010] M.-P. Véron-Cetty and P. Véron. A catalogue of quasars and active nuclei: 13th edition . A&A , 518 pp. 10, July 2010.
Images
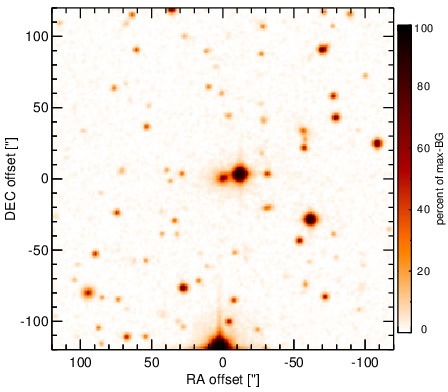
Optical image (DSS, red filter). Displayed are the central 4 arcmin with North being up and East to the left. The colour scaling is linear with white corresponding to the median background (BG) and black to the 0.01% pixels with the highest intensity.
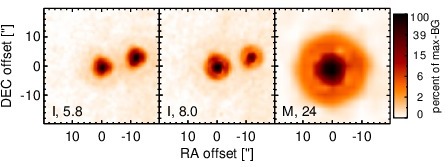
Spitzer MIR images. Displayed are the inner 40 arcsec with North being up and East to the left. The colour scaling is logarithmic with white corresponding to median BG and black to the 0.1% pixels with the highest intensity. The label in the bottom left states instrument and central wavelength of the filter in micron (I: IRAC, M: MIPS).
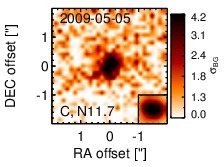
Subarcsecond-resolution MIR images sorted by increasing filter central wavelength. Displayed are the inner 4 arcsec with North being up and East to the left. The colour scaling is logarithmic with white corresponding to median BG and black to the 75% of the highest intensity of all images in units of sig_bg. The inset image (where present; either bottom or top right) shows the central arcsecond of the PSF from the calibrator star, scaled to match the science target. The labels in the bottom left state instrument and filter names (C: COMICS, M: Michelle, T: T-ReCS, V: VISIR).
SEDs
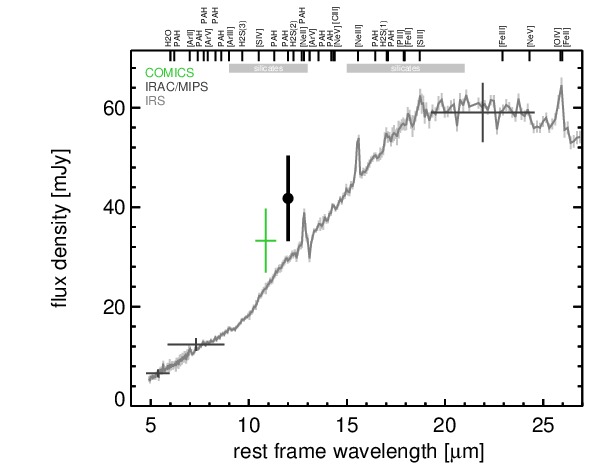
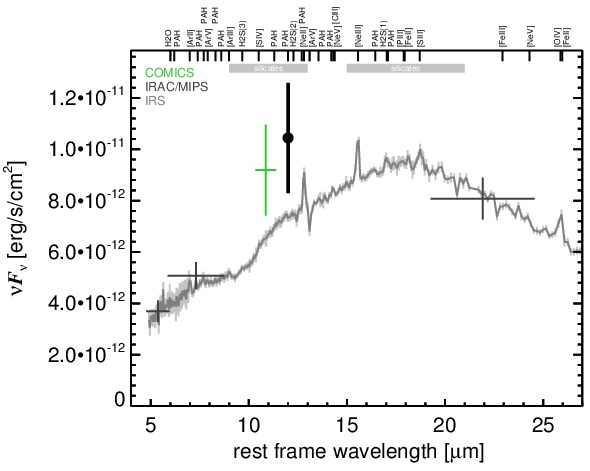
MIR SED. The description of the symbols in all the SED plots (where present) is the following: Grey crosses and solid lines mark the Spitzer/IRAC, MIPS and IRS data. The colour coding of the other symbols is as follows: green for COMICS, magenta for Michelle, blue for T-ReCS and red for VISIR data. Darker-coloured solid lines mark spectra of the corresponding instrument. The black filled circles mark the nuclear 12 and 18 micron continuum emission estimate from the data (where present). The ticks on the top axis mark positions of common MIR emission lines, while the light grey horizontal bars mark wavelength ranges affected by the silicate 10 and 18 micron features.