Sasmirala Individual Information for 3C 459
Description
3C 459 is a FR II radio source identified with the infrared ultra-luminous, disturbed early-type galaxy LEDA 70899 [zheng_hst_1999] at a redshift of z = 0.2201 (D ~ 1125 Mpc). Its optical classification is controversial in the literature: it is classified as a type I AGN by [buttiglione_optical_2009, buttiglione_optical_2010], based on which [veron-cetty_catalogue_2010] presumably classified it as a Sy 1, while [tadhunter_optical_1993], [eracleous_doubled-peaked_1994], and [buchanan_radio-excess_2006] do not find evidence for broad lines and, thus, classify it as a type II object. Finally, [zheng_hst_1999] classify it as a LINER. Based on the presence of an intense starburst in 3C 459 [thomasson_3c459:_2003], we treat this object as an AGN/starburst composite. 3C 459 features an asymmetric supergalactic-scale biconical radio morphology along the east-west axis (PA~ 95∘; [ulvestad_radio_1985, morganti_radio_1993]). The first successful MIR observations were performed with ISO/ISOCAM [siebenmorgen_isocam_2004]. This was then followed up with Spitzer/IRS and MIPS, where it appears unresolved. Our MIPS 24 μm photometry agrees with the value given in [dicken_origin_2008]. The IRS LR staring-mode spectrum was first published in [haas_spitzer_2005] and shows silicate absorption, strong PAH emission, and a red spectral slope in νFν-space, as expected for intense star formation. The VISIR SIC observation from 2010 has, to our knowledge, not yet been published. Unfortunately, 3C 459 remains undetected in the corresponding image. The derived upper limit on the nuclear SIC flux is consistent with the Spitzer spectrophotometry.
- [buchanan_radio-excess_2006] Catherine L. Buchanan, Peter J. McGregor, Geoffrey V. Bicknell, and Michael A. Dopita. Radio-excess IRAS galaxies. IV. optical spectroscopy . AJ , 132 pp. 27–49, July 2006.
- [buttiglione_optical_2009] S. Buttiglione, A. Capetti, A. Celotti, D. J. Axon, M. Chiaberge, F. D. Macchetto, and W. B. Sparks. An optical spectroscopic survey of the 3CR sample of radio galaxies with z < 0.3. i. presentation of the data . A&A , 495 pp. 1033–1060, March 2009.
- [buttiglione_optical_2010] S. Buttiglione, A. Capetti, A. Celotti, D. J. Axon, M. Chiaberge, F. D. Macchetto, and W. B. Sparks. An optical spectroscopic survey of the 3CR sample of radio galaxies with z < 0.3 . II. spectroscopic classes and accretion modes in radio-loud AGN . A&A , 509 pp. 6, January 2010.
- [dicken_origin_2008] D. Dicken, C. Tadhunter, R. Morganti, C. Buchanan, T. Oosterloo, and D. Axon. The origin of the infrared emission in radio galaxies. i. new mid- to far-infrared and radio observations of the 2 jy sample . ApJ , 678 pp. 712–728, May 2008.
- [eracleous_doubled-peaked_1994] Michael Eracleous and Jules P. Halpern. Doubled-peaked emission lines in active galactic nuclei . ApJS , 90 pp. 1–30, January 1994.
- [haas_spitzer_2005] M. Haas, R. Siebenmorgen, B. Schulz, E. Krügel, and R. Chini. Spitzer IRS spectroscopy of 3CR radio galaxies and quasars: testing the unified schemes . A&A , 442 pp. L39–L43, November 2005.
- [morganti_radio_1993] R. Morganti, N. E. B. Killeen, and C. N. Tadhunter. The radio structures of southern 2-JY radio sources . MNRAS , 263 pp. 1023, August 1993.
- [siebenmorgen_isocam_2004] R. Siebenmorgen, W. Freudling, E. Krügel, and M. Haas. ISOCAM survey and dust models of 3CR radio galaxies and quasars . A&A , 421 pp. 129–145, July 2004.
- [tadhunter_optical_1993] C. N. Tadhunter, R. Morganti, S. di Serego-Alighieri, R. A. E. Fosbury, and I. J. Danziger. Optical spectroscopy of a complete sample of southern 2-JY radio sources . MNRAS , 263 pp. 999, August 1993.
- [thomasson_3c459:_2003] P. Thomasson, D. J. Saikia, and T. W. B. Muxlow. 3C459: a highly asymmetric radio galaxy with a starburst . MNRAS , 341 pp. 91–99, May 2003.
- [ulvestad_radio_1985] J. S. Ulvestad. The radio structure and host galaxy of 3C 459 . ApJ , 288 pp. 514–520, January 1985.
- [veron-cetty_catalogue_2010] M.-P. Véron-Cetty and P. Véron. A catalogue of quasars and active nuclei: 13th edition . A&A , 518 pp. 10, July 2010.
- [zheng_hst_1999] Z. Zheng, H. Wu, S. Mao, X.-Y. Xia, Z.-G. Deng, and Z.-L. Zou. An HST surface photometric study of ultraluminous infrared galaxies . A&A , 349 pp. 735–750, September 1999.
Images
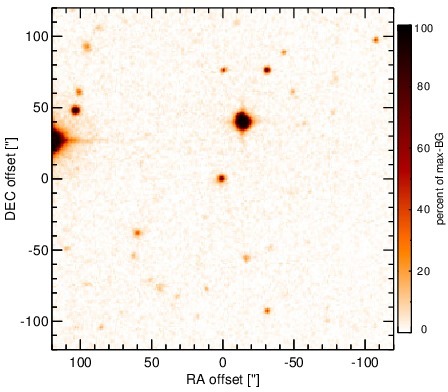
Optical image (DSS, red filter). Displayed are the central 4 arcmin with North being up and East to the left. The colour scaling is linear with white corresponding to the median background (BG) and black to the 0.01% pixels with the highest intensity.
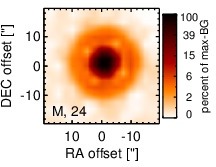
Spitzer MIR images. Displayed are the inner 40 arcsec with North being up and East to the left. The colour scaling is logarithmic with white corresponding to median BG and black to the 0.1% pixels with the highest intensity. The label in the bottom left states instrument and central wavelength of the filter in micron (I: IRAC, M: MIPS).
SEDs
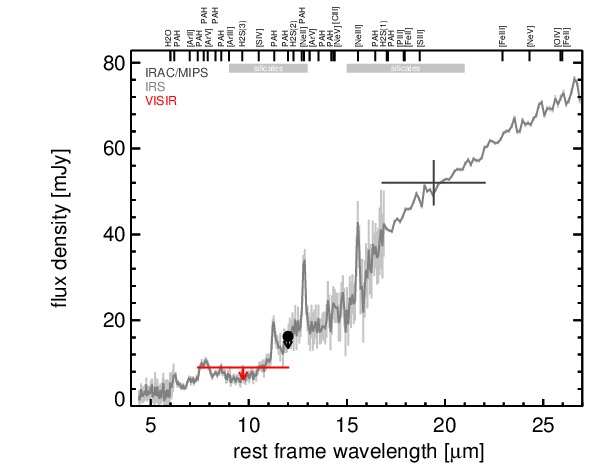
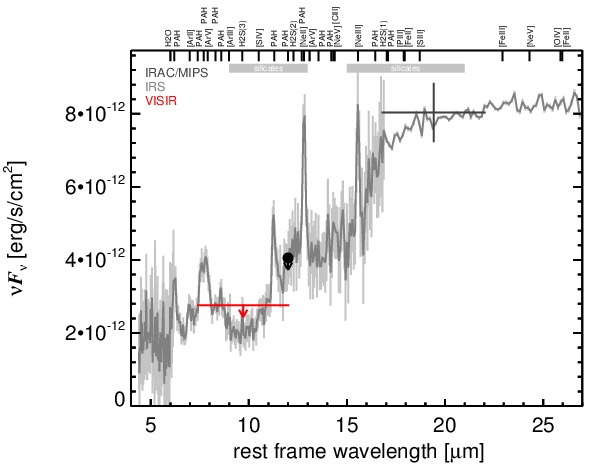
MIR SED. The description of the symbols in all the SED plots (where present) is the following: Grey crosses and solid lines mark the Spitzer/IRAC, MIPS and IRS data. The colour coding of the other symbols is as follows: green for COMICS, magenta for Michelle, blue for T-ReCS and red for VISIR data. Darker-coloured solid lines mark spectra of the corresponding instrument. The black filled circles mark the nuclear 12 and 18 micron continuum emission estimate from the data (where present). The ticks on the top axis mark positions of common MIR emission lines, while the light grey horizontal bars mark wavelength ranges affected by the silicate 10 and 18 micron features.