Sasmirala Individual Information for 3C 78
Description
3C 78 is a FR I radio source coinciding with the early-type spiral galaxy NGC 1218 at a redshift of z = 0.0287 (D ~ 127 Mpc), which is a radio-loud Sy 1 AGN. A prominent synchrotron jet, similar to M87, was detected at radio and optical wavelengths (PA~ 50∘; [unger_kiloparsec_1984, sparks_discovery_1995]), which coincides with the inner optical emission line structure [baum_extended_1988]. The first MIR observations of 3C 78 were performed by [heckman_infrared_1983]. In addition to IRAS, Spitzer/IRAC and MIPS images are also available, which show a compact MIR nucleus embedded within diffuse lenticular host emission. No IRS spectrum is available but the nuclear IRAC 5.8 and 8.0 μm and MIPS 24 μm fluxes indicate a blue spectral slope in νFν-space. 3C 78 was observed with VISIR in the SIC filter in 2006 but remained undetected [van_der_wolk_dust_2010]. Our derived flux upper limit from the same data is significantly higher that of [van_der_wolk_dust_2010]. The fact that the upper limit is lower than the Spitzer photometry indicates in any case that the total MIR emission of 3C 78 is dominated by non-nuclear emission.
- [baum_extended_1988] Stefi Alison Baum, Timothy M. Heckman, Alan Bridle, Wil J. M. van Breugel, and George K. Miley. Extended optical-line-emitting gas in radio galaxies - broad-band optical, narrow-band optical, and radio imaging of a representative sample . ApJS , 68 pp. 643–714, December 1988.
- [heckman_infrared_1983] T. M. Heckman, M. J. Lebofsky, G. H. Rieke, and W. van Breugel. An infrared and optical investigation of galactic nuclei with compact radio sources . ApJ , 272 pp. 400–410, September 1983.
- [sparks_discovery_1995] William B. Sparks, Daniel Golombek, Stefi A. Baum, John Biretta, Sigrid de Koff, Ferdinando Macchetto, Patrick McCarthy, and George K. Miley. Discovery of an optical synchrotron jet in 3C 78 . ApJL , 450 pp. L55, September 1995.
- [unger_kiloparsec_1984] S. W. Unger, R. V. Booler, and A. Pedlar. A kiloparsec radio jet in the nucleus of the s0 galaxy NGC 1218 (3C78) . MNRAS , 207 pp. 679–684, April 1984.
- [van_der_wolk_dust_2010] G. van der Wolk, P. D. Barthel, R. F. Peletier, and J. W. Pel. Dust tori in radio galaxies . A&A , 511 pp. 64, February 2010.
Images
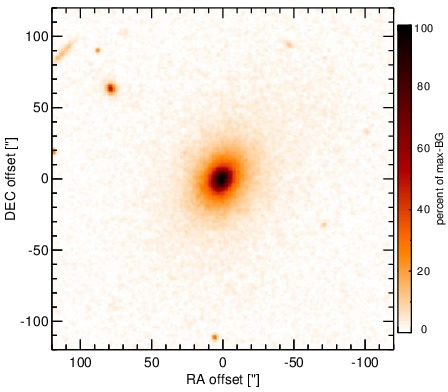
Optical image (DSS, red filter). Displayed are the central 4 arcmin with North being up and East to the left. The colour scaling is linear with white corresponding to the median background (BG) and black to the 0.01% pixels with the highest intensity.
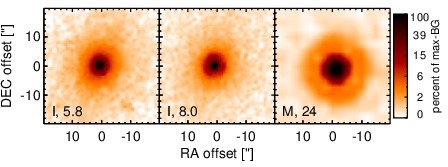
Spitzer MIR images. Displayed are the inner 40 arcsec with North being up and East to the left. The colour scaling is logarithmic with white corresponding to median BG and black to the 0.1% pixels with the highest intensity. The label in the bottom left states instrument and central wavelength of the filter in micron (I: IRAC, M: MIPS).
SEDs
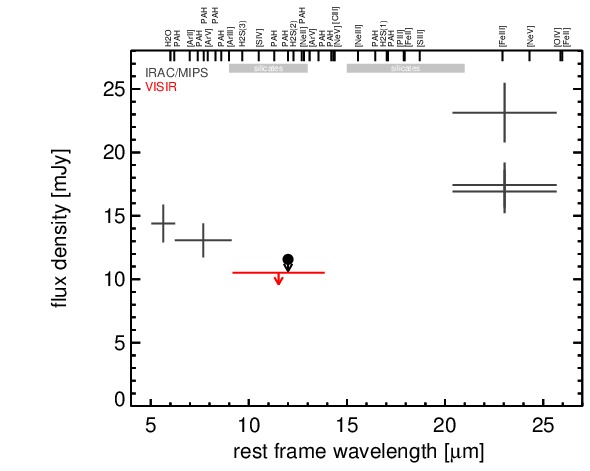
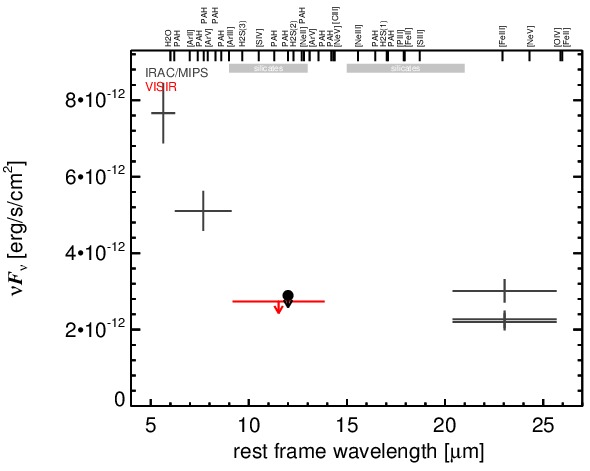
MIR SED. The description of the symbols in all the SED plots (where present) is the following: Grey crosses and solid lines mark the Spitzer/IRAC, MIPS and IRS data. The colour coding of the other symbols is as follows: green for COMICS, magenta for Michelle, blue for T-ReCS and red for VISIR data. Darker-coloured solid lines mark spectra of the corresponding instrument. The black filled circles mark the nuclear 12 and 18 micron continuum emission estimate from the data (where present). The ticks on the top axis mark positions of common MIR emission lines, while the light grey horizontal bars mark wavelength ranges affected by the silicate 10 and 18 micron features.