Sasmirala Individual Information for 3C 98
Description
3C 98 is a FR II radio source identified with the elliptical galaxy LEDA 14213 at a redshift of z = 0.0305 (D ~ 137 Mpc). It contains a radio-loud Sy 2 AGN [veron-cetty_catalogue_2010]. It features the classical FR II super-galactic radio lobes in the north-south directions with a collimated jet extending into the northern lobe (PA~ 20∘; e.g., [baum_extended_1988, leahy_study_1997]). The first MIR observations of 3C 98 were carried out with IRTF and only tentatively detected nuclear emission [elvis_1-20_1984]. 3C 98 was also observed with ISO/ISOCAM [siebenmorgen_isocam_2004] and Spitzer/IRAC, IRS and MIPS. A compact nucleus was detected in the corresponding images with possible weak diffuse emission in the MIPS 24 μm image. Our nuclear MIPS 24 μm photometry is consistent with [dicken_origin_2010]. The IRS LR mapping-mode spectrum suffers from low S/N and does not display any obvious spectral features apart from a shallow emission peak at ~ 18 μm in νFν-space (see also [dicken_spitzer_2012]). 3C 98 was imaged with VISIR in the broad SIC filter in 2005, and a compact nucleus was weakly detected [van_der_wolk_dust_2010]. The low S/N does not allow for any robust conclusion about the nuclear extension at subarcsecond scales in the MIR. Our nuclear SIC flux is consistent with [van_der_wolk_dust_2010] and the Spitzer spectrophotometry. Note that the these authors attribute the nuclear MIR emission to thermal processes.
- [baum_extended_1988] Stefi Alison Baum, Timothy M. Heckman, Alan Bridle, Wil J. M. van Breugel, and George K. Miley. Extended optical-line-emitting gas in radio galaxies - broad-band optical, narrow-band optical, and radio imaging of a representative sample . ApJS , 68 pp. 643–714, December 1988.
- [dicken_origin_2010] D. Dicken, C. Tadhunter, D. Axon, A. Robinson, R. Morganti, and P. Kharb. The origin of the infrared emission in radio galaxies. III. analysis of 3CRR objects . ApJ , 722 pp. 1333–1341, October 2010.
- [dicken_spitzer_2012] D. Dicken, C. Tadhunter, D. Axon, R. Morganti, A. Robinson, M. B. N. Kouwenhoven, H. Spoon, P. Kharb, K. J. Inskip, J. Holt, C. Ramos Almeida, and N. P. H. Nesvadba. Spitzer mid-IR spectroscopy of powerful 2 jy and 3CRR radio galaxies. i. evidence against a strong starburst-AGN connection in radio-loud AGN . ApJ , 745 pp. 172, February 2012.
- [elvis_1-20_1984] M. Elvis, S. P. Willner, G. Fabbiano, N. P. Carleton, A. Lawrence, and M. Ward. 1-20 micron infrared photometry of 3CR radio galaxies . ApJ , 280 pp. 574–579, May 1984.
- [leahy_study_1997] J. P. Leahy, A. R. S. Black, J. Dennett-Thorpe, M. J. Hardcastle, S. Komissarov, R. A. Perley, J. M. Riley, and P. A. G. Scheuer. A study of FRII radio galaxies with z<0.15 - II. high-resolution maps of 11 sources at 3.6 CM . MNRAS , 291 pp. 20–53, October 1997.
- [siebenmorgen_isocam_2004] R. Siebenmorgen, W. Freudling, E. Krügel, and M. Haas. ISOCAM survey and dust models of 3CR radio galaxies and quasars . A&A , 421 pp. 129–145, July 2004.
- [van_der_wolk_dust_2010] G. van der Wolk, P. D. Barthel, R. F. Peletier, and J. W. Pel. Dust tori in radio galaxies . A&A , 511 pp. 64, February 2010.
- [veron-cetty_catalogue_2010] M.-P. Véron-Cetty and P. Véron. A catalogue of quasars and active nuclei: 13th edition . A&A , 518 pp. 10, July 2010.
Images
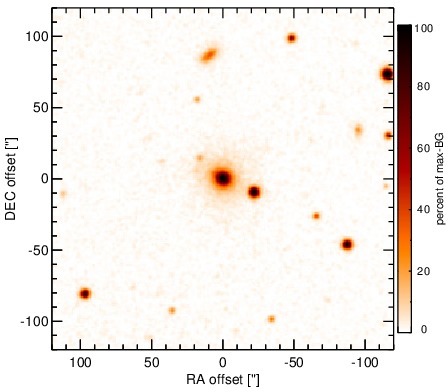
Optical image (DSS, red filter). Displayed are the central 4 arcmin with North being up and East to the left. The colour scaling is linear with white corresponding to the median background (BG) and black to the 0.01% pixels with the highest intensity.
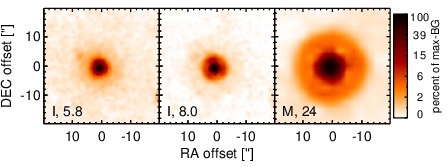
Spitzer MIR images. Displayed are the inner 40 arcsec with North being up and East to the left. The colour scaling is logarithmic with white corresponding to median BG and black to the 0.1% pixels with the highest intensity. The label in the bottom left states instrument and central wavelength of the filter in micron (I: IRAC, M: MIPS).
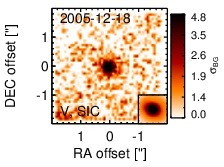
Subarcsecond-resolution MIR images sorted by increasing filter central wavelength. Displayed are the inner 4 arcsec with North being up and East to the left. The colour scaling is logarithmic with white corresponding to median BG and black to the 75% of the highest intensity of all images in units of sig_bg. The inset image (where present; either bottom or top right) shows the central arcsecond of the PSF from the calibrator star, scaled to match the science target. The labels in the bottom left state instrument and filter names (C: COMICS, M: Michelle, T: T-ReCS, V: VISIR).
SEDs
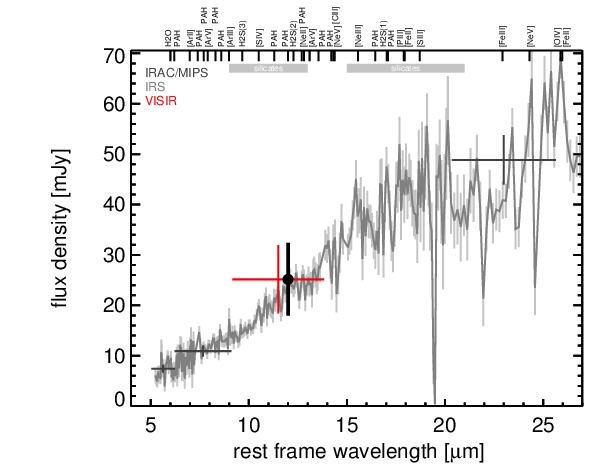
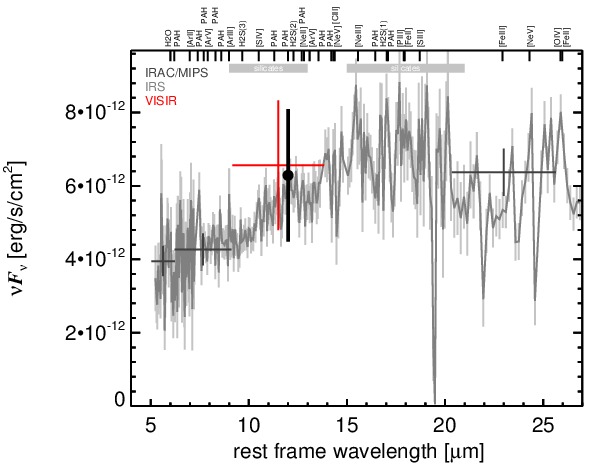
MIR SED. The description of the symbols in all the SED plots (where present) is the following: Grey crosses and solid lines mark the Spitzer/IRAC, MIPS and IRS data. The colour coding of the other symbols is as follows: green for COMICS, magenta for Michelle, blue for T-ReCS and red for VISIR data. Darker-coloured solid lines mark spectra of the corresponding instrument. The black filled circles mark the nuclear 12 and 18 micron continuum emission estimate from the data (where present). The ticks on the top axis mark positions of common MIR emission lines, while the light grey horizontal bars mark wavelength ranges affected by the silicate 10 and 18 micron features.