Sasmirala Individual Information for Cen A
Description
Cen A is the closest and one of the best-studied AGN, hosted in a S0 peculiar galaxy (D = 3.8 ± 0.1 Mpc; [harris_distance_2010]; see [israel_centaurus_1998, morganti_many_2010] for reviews). It is usually treated as a radio-loud Sy 2 (e.g., NED), albeit being completely obscured in the optical. Cen A has a supergalactic-scale FR I radio morphology with biconical lobes and a twin jet (inner PA~ 55∘; e.g., [schreier_detection_1981]). The source may be an ongoing major merger between a massive elliptical and a spiral galaxy, as indicated by the peculiar morphology such as the warped lane of dust and gas (PA~ 122∘; [dufour_picture_1979]). Cen A was among the first AGN to be observed at MIR wavelengths, with repeated N-band photometry available over several decades [becklin_infrared_1971, kleinmann_10-micron_1974, grasdalen_infrared_1976, telesco_extended_1978, frogel_8-13_1982, krabbe_n-band_2001, karovska_spatially_2003, siebenmorgen_mid-infrared_2004]. It was also observed with Spitzer/IRAC, IRS and MIPS multiple times. The host galaxy, in particular the warped dust disc, and the large-scale jet are clearly visible in the MIPS image [quillen_spitzer_2006, hardcastle_infrared_2006]. The PBCD IRAC images are saturated in the nuclei and, thus, are not used for the nuclear photometry. The IRS LR staring-mode spectra show deep silicate (10 μm) absorption and weak PAH emission (see also [weedman_mid-infrared_2005]). Cen A was also among the first AGN to be observed with 8-meter class telescopes in the MIR. [hardcastle_infrared_2006] and [radomski_gemini_2008] presented T-ReCS N- and Q-band imaging taken in 2004 in various filters. they found an unresolved nucleus embedded in diffuse extended emission. In addition, VISIR N- and Q-band imaging was performed by [horst_mid_2008], [reunanen_vlt_2010] and [van_der_wolk_dust_2010] in 2006. We also analysed VISIR N-band images taken in 2010 that are unpublished, to our knowledge. The nuclear morphology agrees with the one found in the pioneering T-ReCS observations in all cases, although the extended component is not always clearly detected. The resulting nuclear fluxes of our reanalysis of the T-ReCS and VISIR images generally agree with the literature values when using similar measurement methods. [gonzalez-martin_dust_2013] published a T-ReCS N-band spectrum, which is similar to the IRS spectrum but without PAH emission features and with marginally lower continuum flux. Combining all the high-angular resolution measurements, there is dispersion on the order of ~ 20% that possibly indicates variability of the nuclear MIR emission of Cen A. This indicates that the MIR emission may be affected by synchrotron emission from the jet base. Recent MIR interferometric observations of Cen A with MIDI show an unresolved (< 1 pc) central source that is attributed to jet emission, and an extended possibly disc-like component, perpendicular to the jet axis [meisenheimer_resolving_2007, burtscher_resolving_2010, burtscher_diversity_2013].
- [becklin_infrared_1971] E. E. Becklin, J. A. Frogel, D. E. Kleinmann, G. Neugebauer, E. P. Ney, and D. W. Strecker. Infrared observations of the core of centaurus a, NGC 5128 . ApJL , 170 pp. L15, November 1971.
- [burtscher_diversity_2013] L. Burtscher, K. Meisenheimer, K. R. W. Tristram, W. Jaffe, S. F. Hönig, R. I. Davies, M. Kishimoto, J.-U. Pott, H. Röttgering, M. Schartmann, G. Weigelt, and S. Wolf. A diversity of dusty AGN tori. data release for the VLTI/MIDI AGN large program and first results for 23 galaxies . A&A , 558 pp. 149, October 2013.
- [burtscher_resolving_2010] Leonard Burtscher, Klaus Meisenheimer, Walter Jaffe, Konrad R. W. Tristram, and Huub J. A. Röttgering. Resolving the nucleus of centaurus a at mid-infrared wavelengths . PASA , 27 pp. 490–495, October 2010.
- [dufour_picture_1979] R. J. Dufour, C. A. Harvel, D. M. Martins, F. H. Schiffer, D. L. Talent, D. C. Wells, S. van den Bergh, and R. J. Talbot. Picture processing analysis of the optical structure of NGC 5128 /Centaurus a/ . AJ , 84 pp. 284–301, March 1979.
- [frogel_8-13_1982] J. F. Frogel, J. H. Elias, and M. M. Phillips. 8-13 micron observations of nine emission-line galaxies . ApJ , 260 pp. 70–74, September 1982.
- [gonzalez-martin_dust_2013] O. González-Martín, J. M. Rodríguez-Espinosa, T. Díaz-Santos, C. Packham, A. Alonso-Herrero, P. Esquej, C. Ramos Almeida, R. Mason, and C. Telesco. Dust in active galactic nuclei. mid-infrared t-ReCS/Gemini spectra using the new RedCan pipeline . A&A , 553 pp. 35, May 2013.
- [grasdalen_infrared_1976] G. L. Grasdalen and R. R. Joyce. Infrared observations of NGC 5128. . ApJ , 208 pp. 317–322, September 1976.
- [hardcastle_infrared_2006] M. J. Hardcastle, R. P. Kraft, and D. M. Worrall. The infrared jet in centaurus a: multiwavelength constraints on emission mechanisms and particle acceleration . MNRAS , 368 pp. L15–L19, May 2006.
- [harris_distance_2010] Gretchen L. H. Harris, Marina Rejkuba, and William E. Harris. The distance to NGC 5128 (centaurus a) . PASA , 27 pp. 457–462, October 2010.
- [horst_mid_2008] H. Horst, P. Gandhi, A. Smette, and W. J. Duschl. The mid IR - hard x-ray correlation in AGN and its implications for dusty torus models . A&A , 479 pp. 389–396, February 2008.
- [israel_centaurus_1998] F. P. Israel. Centaurus a - NGC 5128 . A&ARv , 8 pp. 237–278, 1998.
- [karovska_spatially_2003] Margarita Karovska, Massimo Marengo, Martin Elvis, Giovanni G. Fazio, Joseph L. Hora, Philip M. Hinz, William F. Hoffmann, Michael Meyer, and Eric Mamajek. Spatially resolved circumnuclear dust in centaurus a . ApJL , 598 pp. L91–L94, December 2003.
- [kleinmann_10-micron_1974] D. E. Kleinmann and E. L. Wright. 10-MICRON observations of southern-hemisphere galaxies . ApJL , 191 pp. L19, July 1974.
- [krabbe_n-band_2001] Alfred Krabbe, Torsten Böker, and Roberto Maiolino. N-band imaging of seyfert nuclei and the mid-infrared-x-ray correlation . ApJ , 557 pp. 626–636, August 2001.
- [meisenheimer_resolving_2007] K. Meisenheimer, K. R. W. Tristram, W. Jaffe, F. Israel, N. Neumayer, D. Raban, H. Röttgering, W. D. Cotton, U. Graser, Th. Henning, Ch. Leinert, B. Lopez, G. Perrin, and A. Prieto. Resolving the innermost parsec of centaurus a at mid-infrared wavelengths . A&A , 471 pp. 453–465, August 2007.
- [morganti_many_2010] Raffaella Morganti. The many faces of the gas in centaurus a (NGC 5128) . PASA , 27 pp. 463–474, October 2010.
- [quillen_spitzer_2006] Alice C. Quillen, Mairi H. Brookes, Jocelyn Keene, Daniel Stern, Charles R. Lawrence, and Michael W. Werner. Spitzer observations of the dusty warped disk of centaurus a . ApJ , 645 pp. 1092–1101, July 2006.
- [radomski_gemini_2008] James T. Radomski, Christopher Packham, N. A. Levenson, Eric Perlman, Lerothodi L. Leeuw, Henry Matthews, Rachel Mason, James M. De Buizer, Charles M. Telesco, and Manuel Orduna. Gemini imaging of mid-infrared emission from the nuclear region of centaurus a . ApJ , 681 pp. 141–150, July 2008.
- [reunanen_vlt_2010] J. Reunanen, M. A. Prieto, and R. Siebenmorgen. VLT diffraction-limited imaging at 11 and 18μm of the nearest active galactic nuclei . MNRAS , 402 pp. 879–894, February 2010.
- [schreier_detection_1981] E. J. Schreier, J. O. Burns, and E. D. Feigelson. Detection of radio emission from the jet in centaurus a . ApJ , 251 pp. 523–529, December 1981.
- [siebenmorgen_mid-infrared_2004] R. Siebenmorgen, E. Krügel, and H. W. W. Spoon. Mid-infrared emission of galactic nuclei. TIMMI2 versus ISO observations and models . A&A , 414 pp. 123–139, January 2004.
- [telesco_extended_1978] C. M. Telesco. Extended 10 micron emission from the dark lane in NGC 5128 /Centaurus a/ . ApJL , 226 pp. L125–L128, December 1978.
- [van_der_wolk_dust_2010] G. van der Wolk, P. D. Barthel, R. F. Peletier, and J. W. Pel. Dust tori in radio galaxies . A&A , 511 pp. 64, February 2010.
- [weedman_mid-infrared_2005] D. W. Weedman, Lei Hao, S. J. U. Higdon, D. Devost, Yanling Wu, V. Charmandaris, B. Brandl, E. Bass, and J. R. Houck. Mid-infrared spectra of classical AGNs observed with the spitzer space telescope . ApJ , 633 pp. 706–716, November 2005.
Images
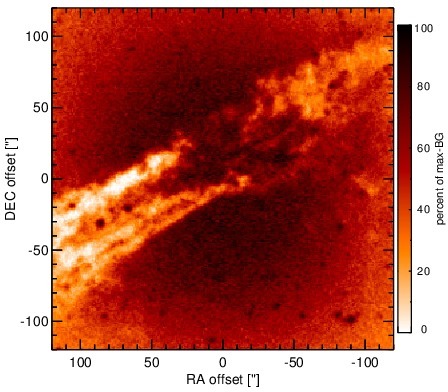
Optical image (DSS, red filter). Displayed are the central 4 arcmin with North being up and East to the left. The colour scaling is linear with white corresponding to the median background (BG) and black to the 0.01% pixels with the highest intensity.
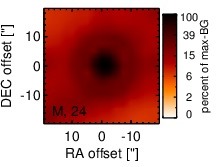
Spitzer MIR images. Displayed are the inner 40 arcsec with North being up and East to the left. The colour scaling is logarithmic with white corresponding to median BG and black to the 0.1% pixels with the highest intensity. The label in the bottom left states instrument and central wavelength of the filter in micron (I: IRAC, M: MIPS).
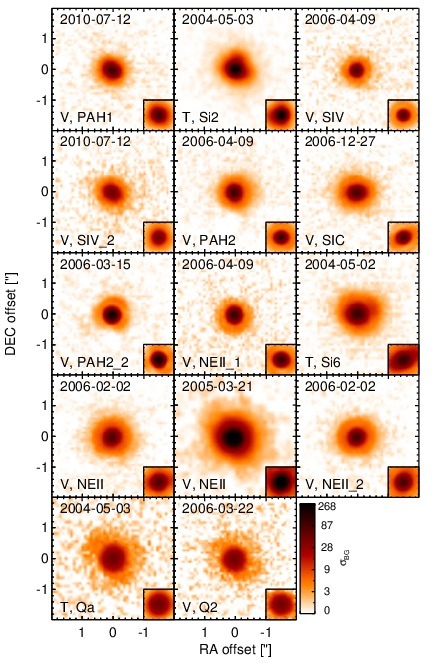
Subarcsecond-resolution MIR images sorted by increasing filter central wavelength. Displayed are the inner 4 arcsec with North being up and East to the left. The colour scaling is logarithmic with white corresponding to median BG and black to the 75% of the highest intensity of all images in units of sig_bg. The inset image (where present; either bottom or top right) shows the central arcsecond of the PSF from the calibrator star, scaled to match the science target. The labels in the bottom left state instrument and filter names (C: COMICS, M: Michelle, T: T-ReCS, V: VISIR).
SEDs
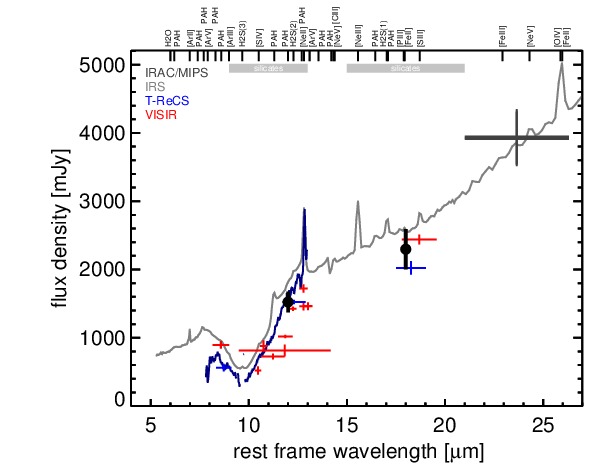
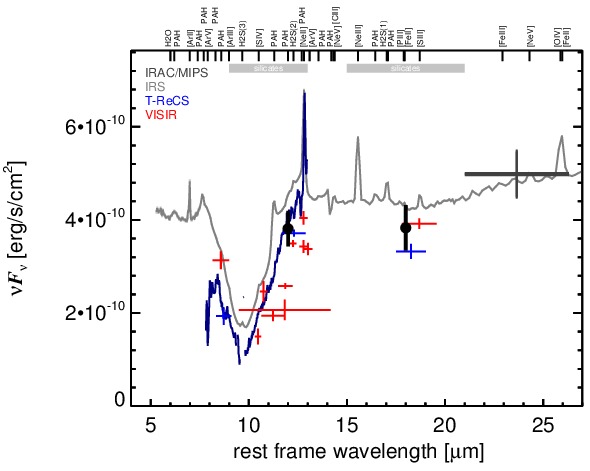
MIR SED. The description of the symbols in all the SED plots (where present) is the following: Grey crosses and solid lines mark the Spitzer/IRAC, MIPS and IRS data. The colour coding of the other symbols is as follows: green for COMICS, magenta for Michelle, blue for T-ReCS and red for VISIR data. Darker-coloured solid lines mark spectra of the corresponding instrument. The black filled circles mark the nuclear 12 and 18 micron continuum emission estimate from the data (where present). The ticks on the top axis mark positions of common MIR emission lines, while the light grey horizontal bars mark wavelength ranges affected by the silicate 10 and 18 micron features.