Sasmirala Individual Information for Cygnus A
Description
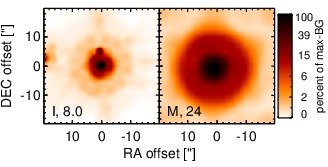
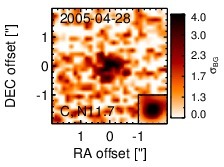
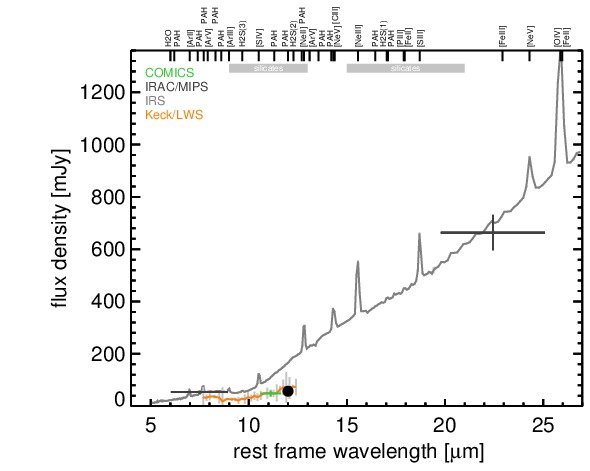
Cygnus A is a FR II radio source identified with the dusty elliptical galaxy MCG+7-41-3 at a redshift of z = 0.0561 (D ~ 257 Mpc; see [carilli_cygnus_1996] for a review). It contains a Sy 2 nucleus [tueller_swift_2008] with broad emission lines in polarized light [ogle_scattered_1997]. It features the classical supergalactic-scale biconical radio lobes fed by highly collimated jets (PA~ 105∘; e.g., [perley_jet_1984]), and kiloparsec-scale ionization cones parallel to the jet axis [jackson_cygnus_1998, canalizo_adaptive_2003]. Interestingly, recently-discovered evidence indicates previous phases of AGN activity in Cygnus A [steenbrugge_multiwavelength_2008, steenbrugge_multiwavelength_2010, chon_discovery_2012]. Early ground-based N-band observations were performed by [rieke_infrared_1972], followed by IRAS [edelson_far-infrared_1987] and ISO observations [haas_far-infrared_1998]. The first subarcsecond-scale MIR images were obtained with Keck/OSCIR in 1998 [radomski_high-resolution_2002] and Keck/LWS in 1999 [whysong_hidden_2001, whysong_thermal_2004]. The images show a compact nucleus with V-shaped emission aligned with the ionization cone and extending ~ 0.5arcsec ~ 0.6 kpc to the east. In addition, [imanishi_9.7_2000] performed Keck/LWS LR N-band spectroscopy in 1999 and detected prominent silicate 10 μm absorption without any PAH emission. Cygnus A was also observed with Spitzer/IRAC, IRS and MIPS and appears compact in the corresponding images. Note that no IRAC 5.8 μm image is available. Our nuclear IRAC 8.0 μm flux is consistent with the value published in [privon_modeling_2012]. The IRS LR staring-mode spectrum shows silicate 10 μm absorption, strong forbidden emission lines and a red spectral slope in νFν-space but no PAH features (see also [shi_9.7_2006, privon_modeling_2012]). Cygnus A was observed with COMICS in the N11.7 filter in 2005, and a weak possibly extended nuclear MIR source was detected (FWHM ~ 0.7 kpc). The low S/N of the detection renders this extension uncertain, but it is consistent with the Keck results. Therefore, we classify the nucleus of Cygnus A as extended on subarcsecond scales in the MIR. The corresponding unresolved nuclear N11.7 flux is consistent with the Keck results and ~ 58% lower than the Spitzer spectrophotometry. In the figure, we also show for comparison the Keck spectrum from [imanishi_9.7_2000], which has been scaled with the COMICS photometry.
- [canalizo_adaptive_2003] Gabriela Canalizo, Claire Max, David Whysong, Robert Antonucci, and Scott E. Dahm. Adaptive optics imaging and spectroscopy of cygnus a. i. evidence for a minor merger . ApJ , 597 pp. 823–831, November 2003.
- [carilli_cygnus_1996] C. L. Carilli and P. D. Barthel. Cygnus a . A&ARv , 7 pp. 1–54, 1996.
- [chon_discovery_2012] Gayoung Chon, Hans Böhringer, Martin Krause, and Joachim Trümper. Discovery of an x-ray cavity near the radio lobes of cygnus a indicating previous AGN activity . A&A , 545 pp. L3, September 2012.
- [edelson_far-infrared_1987] R. A. Edelson and M. A. Malkan. Far-infrared variability in active galactic nuclei . ApJ , 323 pp. 516–535, December 1987.
- [haas_far-infrared_1998] Martin Haas, Rolf Chini, Klaus Meisenheimer, Manfred Stickel, Dietrich Lemke, Ulrich Klaas, and Ernst Kreysa. On the far-infrared emission of quasars . ApJL , 503 pp. L109, August 1998.
- [imanishi_9.7_2000] Masatoshi Imanishi and Shiro Ueno. The 9.7 micron silicate dust absorption toward the cygnus a nucleus and the inferred location of the obscuring dust . ApJ , 535 pp. 626–631, June 2000.
- [jackson_cygnus_1998] Neal Jackson, Clive Tadhunter, and William B. Sparks. Cygnus a: stars, dust and cones . MNRAS , 301 pp. 131–141, November 1998.
- [ogle_scattered_1997] P. M. Ogle, M. H. Cohen, J. S. Miller, H. D. Tran, R. A. E. Fosbury, and R. W. Goodrich. Scattered nuclear continuum and broad h alpha in cygnus a . ApJL , 482 pp. L37, June 1997.
- [perley_jet_1984] R. A. Perley, J. W. Dreher, and J. J. Cowan. The jet and filaments in cygnus a . ApJL , 285 pp. L35–L38, October 1984.
- [privon_modeling_2012] G. C. Privon, S. A. Baum, C. P. O'Dea, J. Gallimore, J. Noel-Storr, D. J. Axon, and A. Robinson. Modeling the infrared emission in cygnus a . ApJ , 747 pp. 46, March 2012.
- [radomski_high-resolution_2002] James T. Radomski, Robert K. Piña, Christopher Packham, Charles M. Telesco, and Clive N. Tadhunter. High-resolution mid-infrared morphology of cygnus a . ApJ , 566 pp. 675–681, February 2002.
- [rieke_infrared_1972] G. H. Rieke and F. J. Low. Infrared photometry of extragalactic sources . ApJL , 176 pp. L95, September 1972.
- [shi_9.7_2006] Y. Shi, G. H. Rieke, D. C. Hines, V. Gorjian, M. W. Werner, K. Cleary, F. J. Low, P. S. Smith, and J. Bouwman. 9.7 μm silicate features in active galactic nuclei: New insights into unification models . ApJ , 653 pp. 127–136, December 2006.
- [steenbrugge_multiwavelength_2008] Katrien C. Steenbrugge, Katherine M. Blundell, and Peter Duffy. Multiwavelength study of cygnus a - II. x-ray inverse-compton emission from a relic counterjet and implications for jet duty cycles . MNRAS , 388 pp. 1465–1472, August 2008.
- [steenbrugge_multiwavelength_2010] Katrien C. Steenbrugge, Ian Heywood, and Katherine M. Blundell. Multiwavelength study of cygnus a - III. evidence for relic lobe plasma . MNRAS , 401 pp. 67–76, January 2010.
- [tueller_swift_2008] J. Tueller, R. F. Mushotzky, S. Barthelmy, J. K. Cannizzo, N. Gehrels, C. B. Markwardt, G. K. Skinner, and L. M. Winter. Swift BAT survey of AGNs . ApJ , 681 pp. 113–127, July 2008.
- [whysong_hidden_2001] D. Whysong and R. Antonucci. A hidden nucleus in cygnus a, but not in m87 . ArXiv Astrophysics e-prints , page 6381, June 2001.
- [whysong_thermal_2004] D. Whysong and R. Antonucci. Thermal emission as a test for hidden nuclei in nearby radio galaxies . ApJ , 602 pp. 116–122, February 2004.
Images

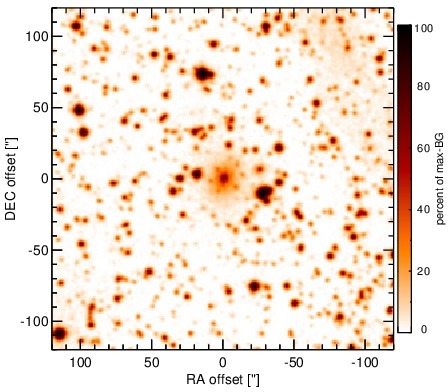
Optical image (DSS, red filter). Displayed are the central 4 arcmin with North being up and East to the left. The colour scaling is linear with white corresponding to the median background (BG) and black to the 0.01% pixels with the highest intensity.

Spitzer MIR images. Displayed are the inner 40 arcsec with North being up and East to the left. The colour scaling is logarithmic with white corresponding to median BG and black to the 0.1% pixels with the highest intensity. The label in the bottom left states instrument and central wavelength of the filter in micron (I: IRAC, M: MIPS).

Subarcsecond-resolution MIR images sorted by increasing filter central wavelength. Displayed are the inner 4 arcsec with North being up and East to the left. The colour scaling is logarithmic with white corresponding to median BG and black to the 75% of the highest intensity of all images in units of sig_bg. The inset image (where present; either bottom or top right) shows the central arcsecond of the PSF from the calibrator star, scaled to match the science target. The labels in the bottom left state instrument and filter names (C: COMICS, M: Michelle, T: T-ReCS, V: VISIR).
SEDs


MIR SED. The description of the symbols in all the SED plots (where present) is the following: Grey crosses and solid lines mark the Spitzer/IRAC, MIPS and IRS data. The colour coding of the other symbols is as follows: green for COMICS, magenta for Michelle, blue for T-ReCS and red for VISIR data. Darker-coloured solid lines mark spectra of the corresponding instrument. The black filled circles mark the nuclear 12 and 18 micron continuum emission estimate from the data (where present). The ticks on the top axis mark positions of common MIR emission lines, while the light grey horizontal bars mark wavelength ranges affected by the silicate 10 and 18 micron features.