Sasmirala Individual Information for ESO 103-35
Description
ESO 103-35 is an inclined early-type galaxy at a redshift of z = 0.0133 (D ~ 59.5 Mpc) hosting a radio-quiet Sy 2 nucleus [veron-cetty_catalogue_2010]. It belongs to the BAT nine-month AGN sample and is an X-ray “buried” AGN candidate [noguchi_new_2009]. The nucleus is obscured in the UV possibly by crossing dust lanes [munoz_marin_atlas_2007]. Furthermore, a H2O mega-maser was discovered in the nucleus of ESO 103-35 [braatz_survey_1996]. [glass_long-term_2004] finds no significant variability in the infrared. After first being detected in the MIR with IRAS, a ground-based LR N-band spectrum was obtained with UKIRT [roche_atlas_1991] before ESO 103-35 was followed up with Spitzer/IRAC, IRS and MIPS. It appears very compact in the Spitzer images with no extended host galaxy emission detected. The IRAC 8 μm PBCD image is partly saturated and no nuclear flux measurement was performed. Our MIPS 24 μm flux is significantly higher than that of [temi_spitzer_2009] but in agreement with the other Spitzer data. The IRS LR staring-mode spectrum shows a deep silicate 10 μm absorption feature and a red spectral slope in νFν-space but no PAH emission (see also [shi_9.7_2006, mullaney_defining_2011]). VISIR images in four N-band filters in a single epoch were taken and analysed by [gandhi_resolving_2009]. ESO 103-35 is possibly elongated in the east-west directions (FWHM~ 0.6arcsec ~ 160 pc). A T-ReCS spectrum from [gonzalez-martin_dust_2013] agrees with our VISIR photometry well. The subarcsecond flux level is ~ 37% lower than the arcsecond resolution level probed by Spitzer, while the SED shape is similar at both scales. We corrected our nuclear 12 μm continuum flux estimate for the silicate absorption by using the T-ReCS spectrum. Note however, that the nuclear flux level would be even lower if the presence of subarcsecond-extended emission can be verified.
- [braatz_survey_1996] J. A. Braatz, A. S. Wilson, and C. Henkel. A survey for h 2O megamasers in active galactic nuclei. i. observations . ApJS , 106 pp. 51, September 1996.
- [gandhi_resolving_2009] P. Gandhi, H. Horst, A. Smette, S. Hönig, A. Comastri, R. Gilli, C. Vignali, and W. Duschl. Resolving the mid-infrared cores of local seyferts . A&A , 502 pp. 457–472, August 2009.
- [glass_long-term_2004] I. S. Glass. Long-term infrared photometry of seyferts . MNRAS , 350 pp. 1049–1066, May 2004.
- [gonzalez-martin_dust_2013] O. González-Martín, J. M. Rodríguez-Espinosa, T. Díaz-Santos, C. Packham, A. Alonso-Herrero, P. Esquej, C. Ramos Almeida, R. Mason, and C. Telesco. Dust in active galactic nuclei. mid-infrared t-ReCS/Gemini spectra using the new RedCan pipeline . A&A , 553 pp. 35, May 2013.
- [mullaney_defining_2011] J. R. Mullaney, D. M. Alexander, A. D. Goulding, and R. C. Hickox. Defining the intrinsic AGN infrared spectral energy distribution and measuring its contribution to the infrared output of composite galaxies . MNRAS , page 474, April 2011.
- [munoz_marin_atlas_2007] VÍctor M. Muñoz Marín, Rosa M. González Delgado, Henrique R. Schmitt, Roberto Cid Fernandes, Enrique Pérez, Thaisa Storchi-Bergmann, Tim Heckman, and Claus Leitherer. An atlas of the circumnuclear regions of 75 seyfert galaxies in the near-ultraviolet with the hubble space telescope advanced camera for surveys . AJ , 134 pp. 648–667, August 2007.
- [noguchi_new_2009] Kazuhisa Noguchi, Yuichi Terashima, and Hisamitsu Awaki. A new sample of buried active galactic nuclei selected from the second XMM-Newton serendipitous source catalogue . ApJ , 705 pp. 454–467, November 2009.
- [roche_atlas_1991] Patrick F. Roche, David K. Aitken, Craig H. Smith, and Martin J. Ward. An atlas of mid-infrared spectra of galaxy nuclei . MNRAS , 248 pp. 606–629, February 1991.
- [shi_9.7_2006] Y. Shi, G. H. Rieke, D. C. Hines, V. Gorjian, M. W. Werner, K. Cleary, F. J. Low, P. S. Smith, and J. Bouwman. 9.7 μm silicate features in active galactic nuclei: New insights into unification models . ApJ , 653 pp. 127–136, December 2006.
- [temi_spitzer_2009] Pasquale Temi, Fabrizio Brighenti, and William G. Mathews. Spitzer observations of passive and star-forming early-type galaxies: An infrared color-color sequence . ApJ , 707 pp. 890–902, December 2009.
- [veron-cetty_catalogue_2010] M.-P. Véron-Cetty and P. Véron. A catalogue of quasars and active nuclei: 13th edition . A&A , 518 pp. 10, July 2010.
Images
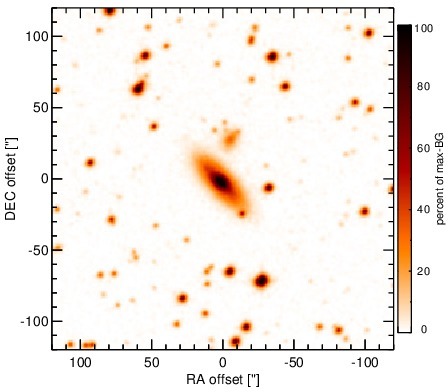
Optical image (DSS, red filter). Displayed are the central 4 arcmin with North being up and East to the left. The colour scaling is linear with white corresponding to the median background (BG) and black to the 0.01% pixels with the highest intensity.
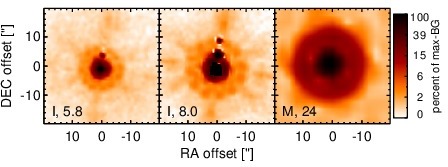
Spitzer MIR images. Displayed are the inner 40 arcsec with North being up and East to the left. The colour scaling is logarithmic with white corresponding to median BG and black to the 0.1% pixels with the highest intensity. The label in the bottom left states instrument and central wavelength of the filter in micron (I: IRAC, M: MIPS).
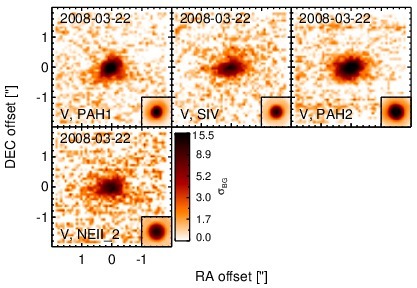
Subarcsecond-resolution MIR images sorted by increasing filter central wavelength. Displayed are the inner 4 arcsec with North being up and East to the left. The colour scaling is logarithmic with white corresponding to median BG and black to the 75% of the highest intensity of all images in units of sig_bg. The inset image (where present; either bottom or top right) shows the central arcsecond of the PSF from the calibrator star, scaled to match the science target. The labels in the bottom left state instrument and filter names (C: COMICS, M: Michelle, T: T-ReCS, V: VISIR).
SEDs
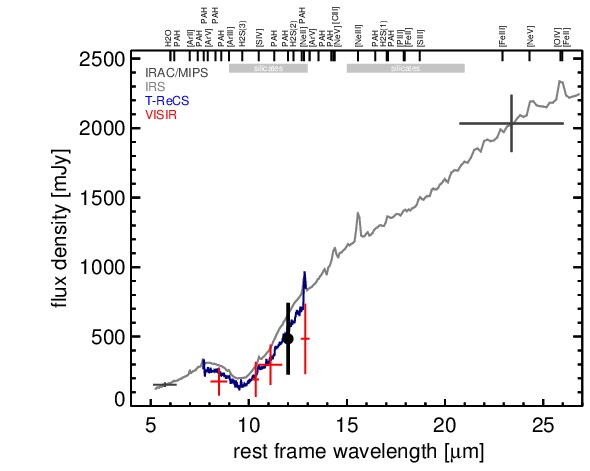
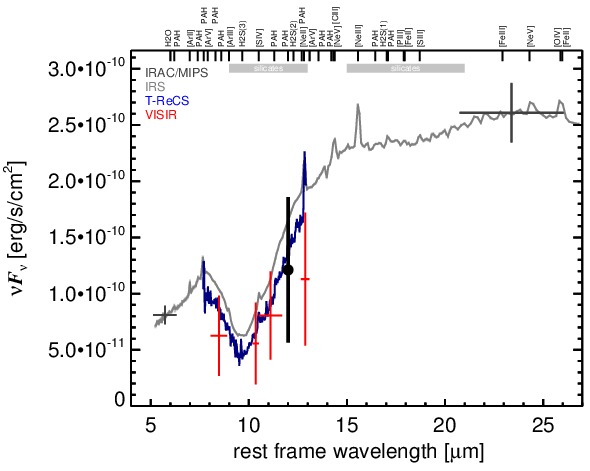
MIR SED. The description of the symbols in all the SED plots (where present) is the following: Grey crosses and solid lines mark the Spitzer/IRAC, MIPS and IRS data. The colour coding of the other symbols is as follows: green for COMICS, magenta for Michelle, blue for T-ReCS and red for VISIR data. Darker-coloured solid lines mark spectra of the corresponding instrument. The black filled circles mark the nuclear 12 and 18 micron continuum emission estimate from the data (where present). The ticks on the top axis mark positions of common MIR emission lines, while the light grey horizontal bars mark wavelength ranges affected by the silicate 10 and 18 micron features.