Sasmirala Individual Information for ESO 138-1
Description
ESO 138-1 is an early-type galaxy at a redshift of z = 0.0091 (D ~ 38.6 Mpc) hosting a radio-quiet Sy 2 nucleus [veron-cetty_catalogue_2010]. It features possibly elongated radio emission on scales of ~ 0.5 kpc along the north-east axis (PA~ 35∘; [morganti_radio_1999]), while the NLR has a complex morphology with jet-like extended emission into the north-western direction on kiloparsec-scales (PA~-95∘; [schmitt_anisotropic_1995]) and another extended emission feature ~ 1arcsec ~ 0.2 kpc towards the south-east (PA~ 135∘; [ferruit_hubble_2000]). After first being detected in the MIR with IRAS, ESO 138-1 was followed up with Spitzer/IRAC, IRS and MIPS observations. The nucleus appears nearly unresolved in the Spitzer images without any detected non-nuclear emission. The IRS LR staring-mode spectrum shows weak PAH emission and the silicate features in emission, which is surprising for a Sy 2, in particular because it is obscured by a Compton-thick column density of gas in X-rays (e.g., [piconcelli_x-ray_2011]; see also [goulding_deep_2012]) The MIR spectrum peaks at ~ 18 μm in νFν-space. We observed ESO 138-1 with VISIR in several narrow N-band filters in 2008 and 2010. A compact MIR nucleus was detected in all the images with no signs of non-nuclear emission. The nucleus appears to be marginally resolved in the images of both epochs but with inconsistent position angles (~ 110∘ and ~ 160∘ respectively). Thus, it remains uncertain, whether the nuclear MIR emission in ESO 138-1 is really resolved or not. Of those, two measurements were published already in [gandhi_resolving_2009]. Our analysis of all images yields flux values consistent with the previous work and the Spitzer spectrophotometry, albeit systematically lower by ~ 5%. Therefore, we do not apply any silicate correction to our nuclear 12 μm continuum flux estimate.
- [ferruit_hubble_2000] Pierre Ferruit, Andrew S. Wilson, and John Mulchaey. Hubble space telescope WFPC2 imaging of a sample of early-type seyfert galaxies . ApJS , 128 pp. 139–169, May 2000.
- [gandhi_resolving_2009] P. Gandhi, H. Horst, A. Smette, S. Hönig, A. Comastri, R. Gilli, C. Vignali, and W. Duschl. Resolving the mid-infrared cores of local seyferts . A&A , 502 pp. 457–472, August 2009.
- [goulding_deep_2012] A. D. Goulding, D. M. Alexander, F. E. Bauer, W. R. Forman, R. C. Hickox, C. Jones, J. R. Mullaney, and M. Trichas. Deep silicate absorption features in compton-thick active galactic nuclei predominantly arise due to dust in the host galaxy . ApJ , 755 pp. 5, August 2012.
- [morganti_radio_1999] R. Morganti, Z. I. Tsvetanov, J. Gallimore, and M. G. Allen. Radio continuum morphology of southern seyfert galaxies . A&AS , 137 pp. 457–471, June 1999.
- [piconcelli_x-ray_2011] E. Piconcelli, S. Bianchi, C. Vignali, E. Jiménez-Bailón, and F. Fiore. X-ray spectroscopy of the compton-thick seyfert 2 ESO 138 - g1 . A&A , 534 pp. 126, October 2011.
- [schmitt_anisotropic_1995] Henrique R. Schmitt and Thaisa Storchi-Bergmann. Anisotropic emission, stellar population and x-ray sources in the seyfert 2 galaxy ESO 138-g01 . MNRAS , 276 pp. 592–596, September 1995.
- [veron-cetty_catalogue_2010] M.-P. Véron-Cetty and P. Véron. A catalogue of quasars and active nuclei: 13th edition . A&A , 518 pp. 10, July 2010.
Images
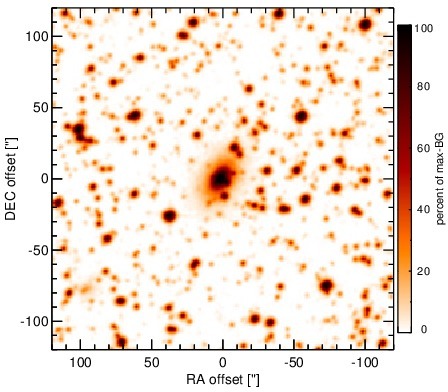
Optical image (DSS, red filter). Displayed are the central 4 arcmin with North being up and East to the left. The colour scaling is linear with white corresponding to the median background (BG) and black to the 0.01% pixels with the highest intensity.
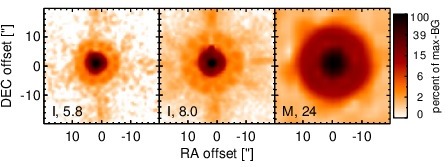
Spitzer MIR images. Displayed are the inner 40 arcsec with North being up and East to the left. The colour scaling is logarithmic with white corresponding to median BG and black to the 0.1% pixels with the highest intensity. The label in the bottom left states instrument and central wavelength of the filter in micron (I: IRAC, M: MIPS).
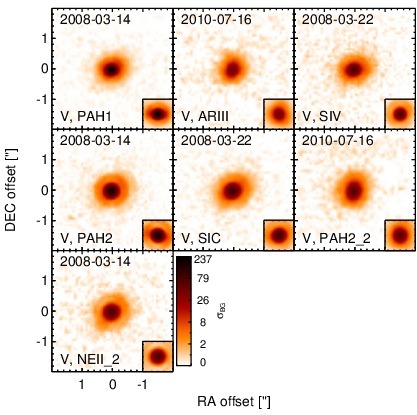
Subarcsecond-resolution MIR images sorted by increasing filter central wavelength. Displayed are the inner 4 arcsec with North being up and East to the left. The colour scaling is logarithmic with white corresponding to median BG and black to the 75% of the highest intensity of all images in units of sig_bg. The inset image (where present; either bottom or top right) shows the central arcsecond of the PSF from the calibrator star, scaled to match the science target. The labels in the bottom left state instrument and filter names (C: COMICS, M: Michelle, T: T-ReCS, V: VISIR).
SEDs
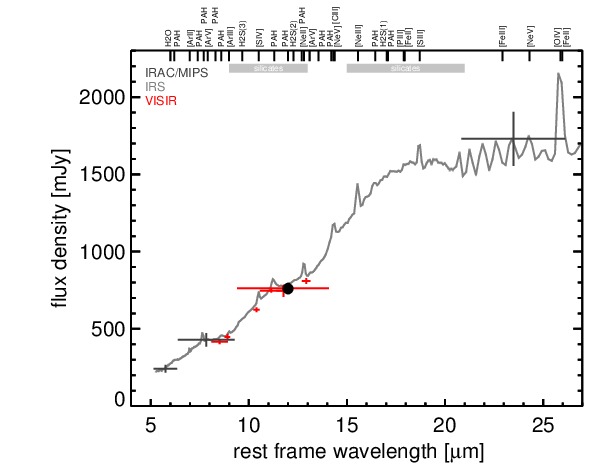
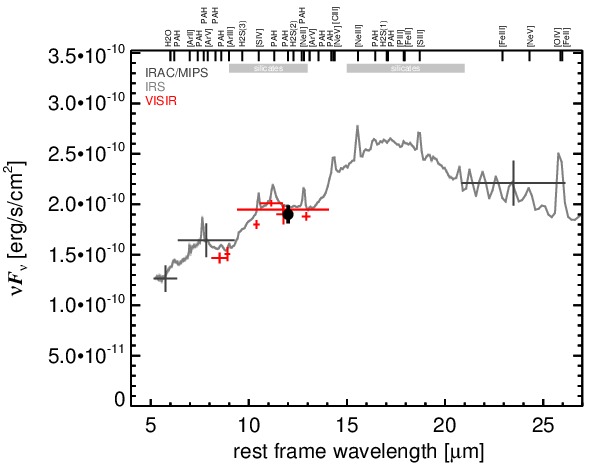
MIR SED. The description of the symbols in all the SED plots (where present) is the following: Grey crosses and solid lines mark the Spitzer/IRAC, MIPS and IRS data. The colour coding of the other symbols is as follows: green for COMICS, magenta for Michelle, blue for T-ReCS and red for VISIR data. Darker-coloured solid lines mark spectra of the corresponding instrument. The black filled circles mark the nuclear 12 and 18 micron continuum emission estimate from the data (where present). The ticks on the top axis mark positions of common MIR emission lines, while the light grey horizontal bars mark wavelength ranges affected by the silicate 10 and 18 micron features.