Sasmirala Individual Information for ESO 198-24
Description
ESO 198-24 is an elliptical galaxy at a redshift of z = 0.0455 (D ~ 192 Mpc) hosting a Sy 1.0 nucleus [veron-cetty_catalogue_2010], which is a member of the nine-month BAT AGN sample. It was observed with Spitzer/IRAC, IRS and MIPS and appears nearly unresolved in the corresponding images. The IRS LR staring-mode spectrum agrees with the IRAC and MIPS photometry well without further scaling and shows strong silicate 10 and 18 μm emission with weak PAH features. The MIR spectral slope is rather flat with a maximum at ~ 18 μm in νFν-space. We observed ESO 198-24 with VISIR in 2009 in three narrow N-band filters spread over two nights. A compact MIR nucleus without any sign of extended or non-nuclear emission was weakly detected. The measured subarcsecond fluxes agree with the Spitzer spectrophotometry and the 12 μm continuum flux estimate is correspondingly corrected for the silicate emission feature.
- [veron-cetty_catalogue_2010] M.-P. Véron-Cetty and P. Véron. A catalogue of quasars and active nuclei: 13th edition . A&A , 518 pp. 10, July 2010.
Images
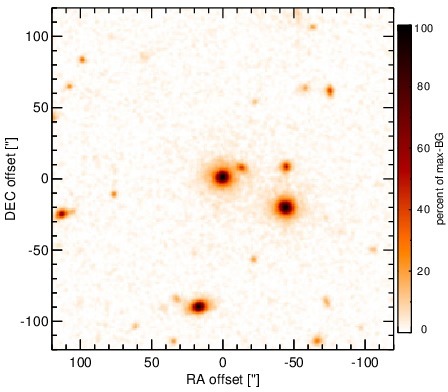
Optical image (DSS, red filter). Displayed are the central 4 arcmin with North being up and East to the left. The colour scaling is linear with white corresponding to the median background (BG) and black to the 0.01% pixels with the highest intensity.
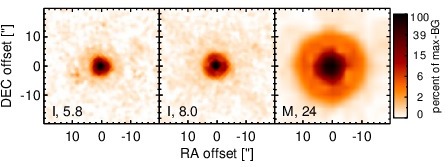
Spitzer MIR images. Displayed are the inner 40 arcsec with North being up and East to the left. The colour scaling is logarithmic with white corresponding to median BG and black to the 0.1% pixels with the highest intensity. The label in the bottom left states instrument and central wavelength of the filter in micron (I: IRAC, M: MIPS).
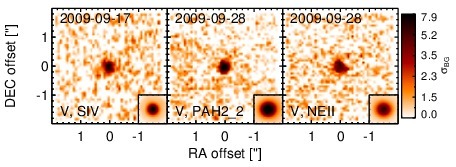
Subarcsecond-resolution MIR images sorted by increasing filter central wavelength. Displayed are the inner 4 arcsec with North being up and East to the left. The colour scaling is logarithmic with white corresponding to median BG and black to the 75% of the highest intensity of all images in units of sig_bg. The inset image (where present; either bottom or top right) shows the central arcsecond of the PSF from the calibrator star, scaled to match the science target. The labels in the bottom left state instrument and filter names (C: COMICS, M: Michelle, T: T-ReCS, V: VISIR).
SEDs
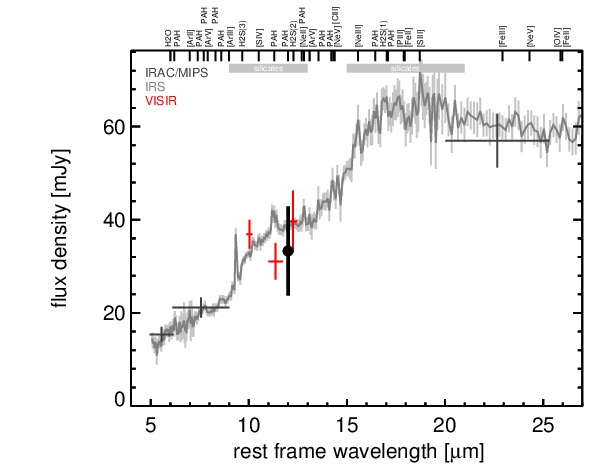
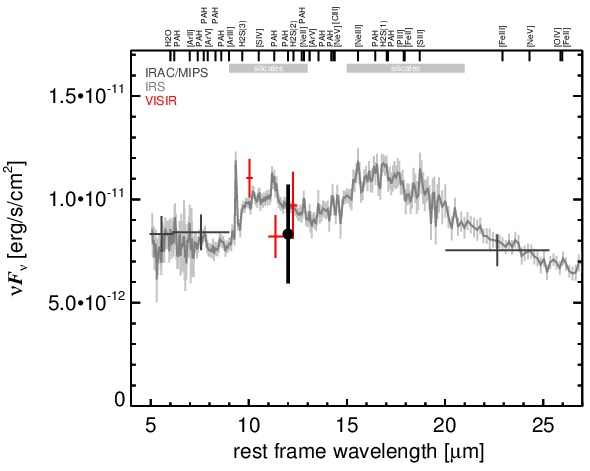
MIR SED. The description of the symbols in all the SED plots (where present) is the following: Grey crosses and solid lines mark the Spitzer/IRAC, MIPS and IRS data. The colour coding of the other symbols is as follows: green for COMICS, magenta for Michelle, blue for T-ReCS and red for VISIR data. Darker-coloured solid lines mark spectra of the corresponding instrument. The black filled circles mark the nuclear 12 and 18 micron continuum emission estimate from the data (where present). The ticks on the top axis mark positions of common MIR emission lines, while the light grey horizontal bars mark wavelength ranges affected by the silicate 10 and 18 micron features.