Sasmirala Individual Information for ESO 253-3
Description
ESO 253-3 is a spiral galaxy at a redshift of z = 0.0425 (D ~ 181 Mpc) hosting an AGN with optical Sy 2 classification [veron-cetty_catalogue_2010]. It was observed with Spitzer/IRAC and IRS, where a nucleus elongated to the north-east with faint extended host galaxy emission being detected. The IRS HR staring-mode spectrum does not overlap with the IRAC photometry but displays possible lower flux levels. The MIR spectral slope is red in νFν-space without any identifiable silicate or PAH features. Note, however, that no background subtraction was performed for this spectrum. ESO 253-3 was observed with T-ReCS in the broad N-band filter in 2004 (unpublished, to our knowledge). In the T-ReCS image, the nucleus (elongated in IRAC) is resolved into two compact sources with a separation of ~ 1.7arcsec ~ 1.4 kpc in the north-east direction. We assume the north-eastern source, ESO 253-3NE, which is significantly brighter, to be the AGN. ESO 253-3NE is possibly extended (FWHM ~ 0.44arcsec ~ 360 pc; PA~ 125∘) but at least a second epoch of subarcsecond MIR imaging is required to verify this extension. Its flux agrees with the IRS spectrum and therefore we use the latter to estimate the 12 μm continuum flux. The nature of the double MIR nucleus of ESO 253-3 remains unknown. It could possibly be a post galaxy merger similar to NGC 6240 but this scenario is not supported by the IRS spectrum.
- [veron-cetty_catalogue_2010] M.-P. Véron-Cetty and P. Véron. A catalogue of quasars and active nuclei: 13th edition . A&A , 518 pp. 10, July 2010.
Images
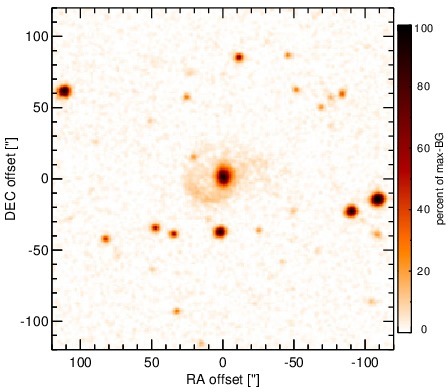
Optical image (DSS, red filter). Displayed are the central 4 arcmin with North being up and East to the left. The colour scaling is linear with white corresponding to the median background (BG) and black to the 0.01% pixels with the highest intensity.
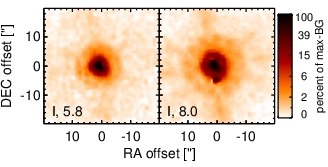
Spitzer MIR images. Displayed are the inner 40 arcsec with North being up and East to the left. The colour scaling is logarithmic with white corresponding to median BG and black to the 0.1% pixels with the highest intensity. The label in the bottom left states instrument and central wavelength of the filter in micron (I: IRAC, M: MIPS).
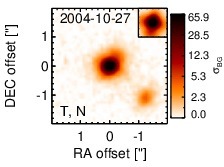
Subarcsecond-resolution MIR images sorted by increasing filter central wavelength. Displayed are the inner 4 arcsec with North being up and East to the left. The colour scaling is logarithmic with white corresponding to median BG and black to the 75% of the highest intensity of all images in units of sig_bg. The inset image (where present; either bottom or top right) shows the central arcsecond of the PSF from the calibrator star, scaled to match the science target. The labels in the bottom left state instrument and filter names (C: COMICS, M: Michelle, T: T-ReCS, V: VISIR).
SEDs
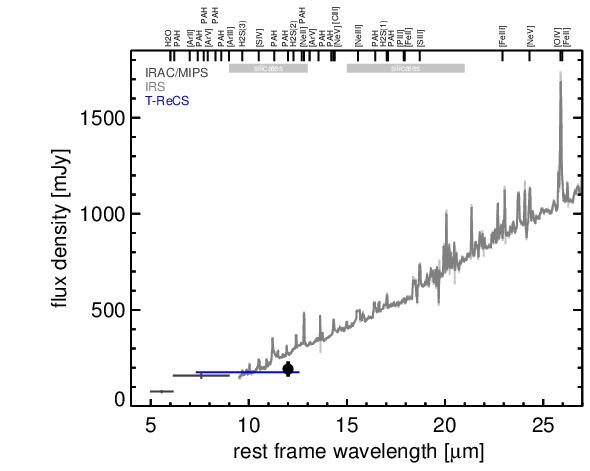
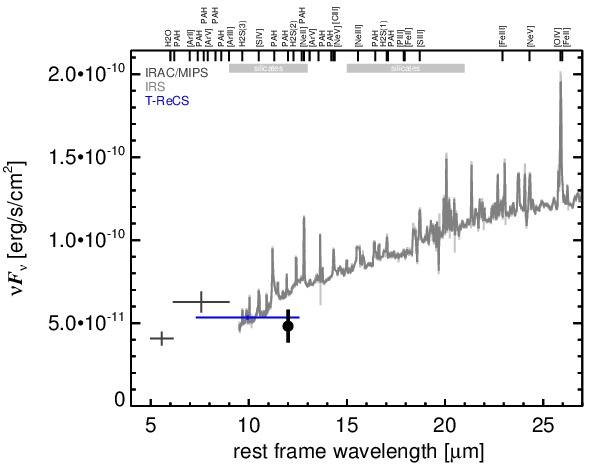
MIR SED. The description of the symbols in all the SED plots (where present) is the following: Grey crosses and solid lines mark the Spitzer/IRAC, MIPS and IRS data. The colour coding of the other symbols is as follows: green for COMICS, magenta for Michelle, blue for T-ReCS and red for VISIR data. Darker-coloured solid lines mark spectra of the corresponding instrument. The black filled circles mark the nuclear 12 and 18 micron continuum emission estimate from the data (where present). The ticks on the top axis mark positions of common MIR emission lines, while the light grey horizontal bars mark wavelength ranges affected by the silicate 10 and 18 micron features.