Sasmirala Individual Information for ESO 263-13
Description
ESO 263-13 is a face-on spiral galaxy at a redshift of z = 0.0335 (D ~ 146 Mpc) and hosts a Sy 2 nucleus [veron-cetty_catalogue_2010]. It was observed with Spitzer/IRAC and IRS. In the IRAC images, a nearly unresolved MIR nucleus with weak spiral-like host galaxy emission was detected. The IRS LR mapping-mode spectrum lacks the lowest wavelength setting and has only a low S/N. Therefore, the presence of silicate and/or PAH features remains uncertain. The MIR spectrum peaks at ~ 18 μm in νFν-space. We observed ESO 263-13 with VISIR in 2007 and 2008 in six different narrow N-band filters (9 observations spread over three epochs). A compact MIR nucleus was detected in all images without any sign of extended host emission. The nucleus is unresolved in the sharpest SIV, PAH1 and PAH2 images. Therefore, it is classified as unresolved in the MIR at subarcsecond scales. The SIC and NEII filter photometry has already been published in [gandhi_resolving_2009], who found ~ 10% lower fluxes than we found in our reanalysis of the same data. Our new subarcsecond flux values are consistent with the Spitzer spectrophotometry but are systematically ~ 7% lower .
- [gandhi_resolving_2009] P. Gandhi, H. Horst, A. Smette, S. Hönig, A. Comastri, R. Gilli, C. Vignali, and W. Duschl. Resolving the mid-infrared cores of local seyferts . A&A , 502 pp. 457–472, August 2009.
- [veron-cetty_catalogue_2010] M.-P. Véron-Cetty and P. Véron. A catalogue of quasars and active nuclei: 13th edition . A&A , 518 pp. 10, July 2010.
Images
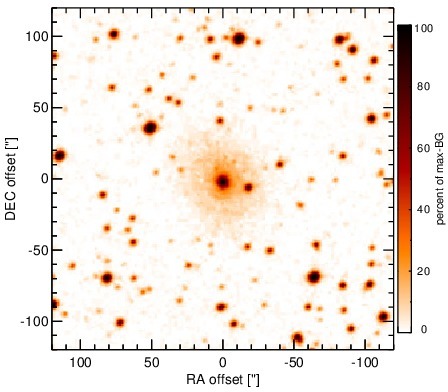
Optical image (DSS, red filter). Displayed are the central 4 arcmin with North being up and East to the left. The colour scaling is linear with white corresponding to the median background (BG) and black to the 0.01% pixels with the highest intensity.
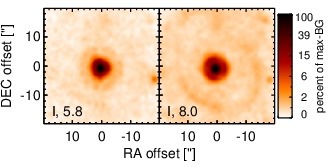
Spitzer MIR images. Displayed are the inner 40 arcsec with North being up and East to the left. The colour scaling is logarithmic with white corresponding to median BG and black to the 0.1% pixels with the highest intensity. The label in the bottom left states instrument and central wavelength of the filter in micron (I: IRAC, M: MIPS).
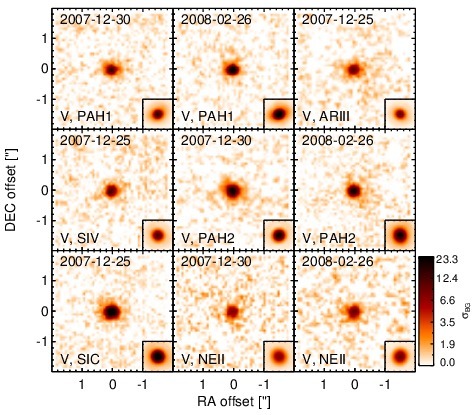
Subarcsecond-resolution MIR images sorted by increasing filter central wavelength. Displayed are the inner 4 arcsec with North being up and East to the left. The colour scaling is logarithmic with white corresponding to median BG and black to the 75% of the highest intensity of all images in units of sig_bg. The inset image (where present; either bottom or top right) shows the central arcsecond of the PSF from the calibrator star, scaled to match the science target. The labels in the bottom left state instrument and filter names (C: COMICS, M: Michelle, T: T-ReCS, V: VISIR).
SEDs
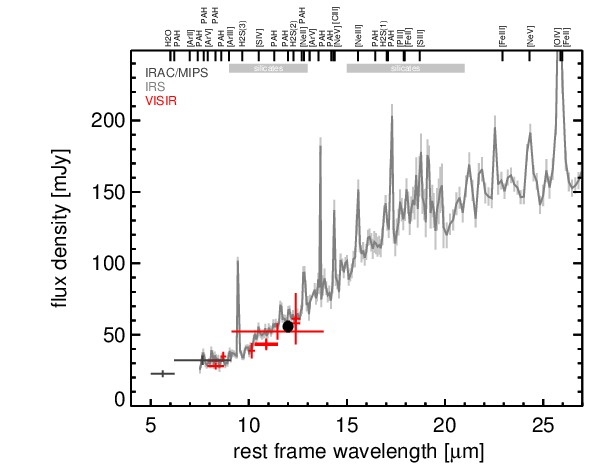
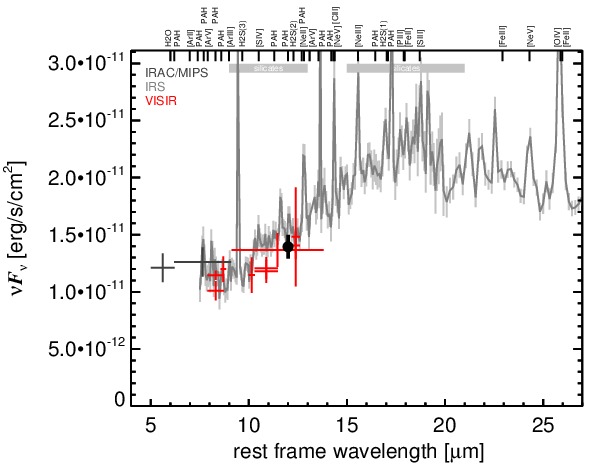
MIR SED. The description of the symbols in all the SED plots (where present) is the following: Grey crosses and solid lines mark the Spitzer/IRAC, MIPS and IRS data. The colour coding of the other symbols is as follows: green for COMICS, magenta for Michelle, blue for T-ReCS and red for VISIR data. Darker-coloured solid lines mark spectra of the corresponding instrument. The black filled circles mark the nuclear 12 and 18 micron continuum emission estimate from the data (where present). The ticks on the top axis mark positions of common MIR emission lines, while the light grey horizontal bars mark wavelength ranges affected by the silicate 10 and 18 micron features.