Sasmirala Individual Information for ESO 286-19
Description
ESO 286-19 is a spiral-like merger system at a redshift of z = 0.043 (D ~ 180 Mpc) classified as an ULIRG with an H II optical nucleus [johansson_extremely_1991, kim_optical_1995, veilleux_optical_1995]. However, multiple lines of evidence suggest that ESO 286-19 harbours a highly obscured AGN [pernechele_spectropolarimetric_2003, risaliti_unveiling_2006, brightman_xmm-newton_2011, imanishi_subaru_2011]. In the MIR, it was observed with Spitzer/IRAC, IRS and MIPS, where it appears as a compact source in all images. The IRAC 5.8 and 8.0 μm and MIPS 24 μm photometry matches well the IRS LR staring-mode spectrum, which was published in [spoon_detection_2006]. The arcsecond-scale MIR SED is dominated by the extremely deep silicate 10 and 18 μm silicate absorption features, and possesses a red slope in νFν-space. PAH emission is present as well and indicates the presence of star formation in ESO 286-19 (see also [farrah_high-resolution_2007] for an IRS HR staring-mode spectrum). The absence of any strong emission features indicates that putative MIR emission-line producing regions are heavily extincted (similar to, e.g., NGC 4945; [perez-beaupuits_deeply_2011]). One subarcsecond-resolution Q-band image with T-ReCS was taken in 2008 [imanishi_subaru_2011]. A compact MIR nucleus without any extended host emission was detected. The source is possibly marginally resolved (FWHM ~ 0.6arcsec ~ 480 pc), however, in absence of other subarcsecond MIR images, the nuclear extension remains uncertain. Our reanalysis of the Q-band image provides a consistent nuclear flux with the published value and also matches the Spitzer spectrophotometry. Therefore, we correct our 12 and 18 μm continuum flux estimates for the silicate absorption features.
- [brightman_xmm-newton_2011] Murray Brightman and Kirpal Nandra. An XMM-Newton spectral survey of 12 μm selected galaxies - II. implications for AGN selection and unification . MNRAS , 414 pp. 3084–3104, July 2011.
- [farrah_high-resolution_2007] D. Farrah, J. Bernard-Salas, H. W. W. Spoon, B. T. Soifer, L. Armus, B. Brandl, V. Charmandaris, V. Desai, S. Higdon, D. Devost, and J. Houck. High-resolution mid-infrared spectroscopy of ultraluminous infrared galaxies . ApJ , 667 pp. 149–169, September 2007.
- [imanishi_subaru_2011] Masatoshi Imanishi, Keisuke Imase, Nagisa Oi, and Kohei Ichikawa. Subaru and gemini high spatial resolution infrared 18 μm imaging observations of nearby luminous infrared galaxies . AJ , 141 pp. 156, May 2011.
- [johansson_extremely_1991] L. Johansson. The extremely luminous galaxy merger ESO 286-IG19 . A&A , 241 pp. 389–398, January 1991.
- [kim_optical_1995] D.-C. Kim, D. B. Sanders, S. Veilleux, J. M. Mazzarella, and B. T. Soifer. Optical spectroscopy of luminous infrared galaxies. i. nuclear data . ApJS , 98 pp. 129, May 1995.
- [perez-beaupuits_deeply_2011] J. P. Pérez-Beaupuits, H. W. W. Spoon, M. Spaans, and J. D. Smith. The deeply obscured AGN of NGC 4945. i. spitzer-IRS maps of [ne v], [ne II], h2 0-0 s(1), s(2), and other tracers . A&A , 533 pp. 56, September 2011.
- [pernechele_spectropolarimetric_2003] C. Pernechele, S. Berta, A. Marconi, C. Bonoli, A. Bressan, A. Franceschini, J. Fritz, and E. Giro. Spectropolarimetric search for hidden active galactic nuclei in four southern ultraluminous infrared galaxies . MNRAS , 338 pp. L13–L17, January 2003.
- [risaliti_unveiling_2006] G. Risaliti, R. Maiolino, A. Marconi, E. Sani, S. Berta, V. Braito, R. Della Ceca, A. Franceschini, and M. Salvati. Unveiling the nature of ultraluminous infrared galaxies with 3-4μm spectroscopy* . MNRAS , 365 pp. 303–320, January 2006.
- [spoon_detection_2006] H. W. W. Spoon, A. G. G. M. Tielens, L. Armus, G. C. Sloan, B. Sargent, J. Cami, V. Charmandaris, J. R. Houck, and B. T. Soifer. The detection of crystalline silicates in ultraluminous infrared galaxies . ApJ , 638 pp. 759–765, February 2006.
- [veilleux_optical_1995] S. Veilleux, D.-C. Kim, D. B. Sanders, J. M. Mazzarella, and B. T. Soifer. Optical spectroscopy of luminous infrared galaxies. II. analysis of the nuclear and long-slit data . ApJS , 98 pp. 171, May 1995.
Images
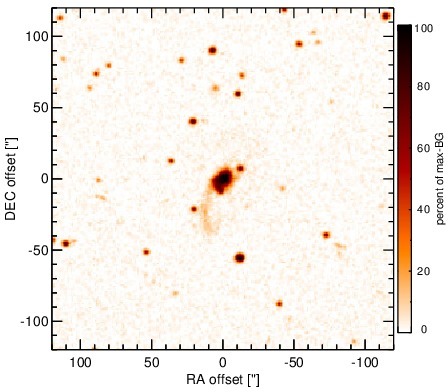
Optical image (DSS, red filter). Displayed are the central 4 arcmin with North being up and East to the left. The colour scaling is linear with white corresponding to the median background (BG) and black to the 0.01% pixels with the highest intensity.
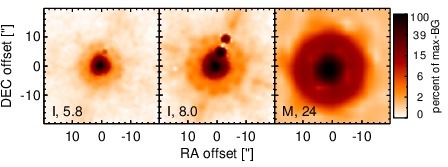
Spitzer MIR images. Displayed are the inner 40 arcsec with North being up and East to the left. The colour scaling is logarithmic with white corresponding to median BG and black to the 0.1% pixels with the highest intensity. The label in the bottom left states instrument and central wavelength of the filter in micron (I: IRAC, M: MIPS).
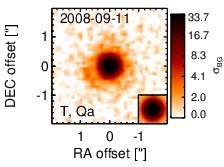
Subarcsecond-resolution MIR images sorted by increasing filter central wavelength. Displayed are the inner 4 arcsec with North being up and East to the left. The colour scaling is logarithmic with white corresponding to median BG and black to the 75% of the highest intensity of all images in units of sig_bg. The inset image (where present; either bottom or top right) shows the central arcsecond of the PSF from the calibrator star, scaled to match the science target. The labels in the bottom left state instrument and filter names (C: COMICS, M: Michelle, T: T-ReCS, V: VISIR).
SEDs
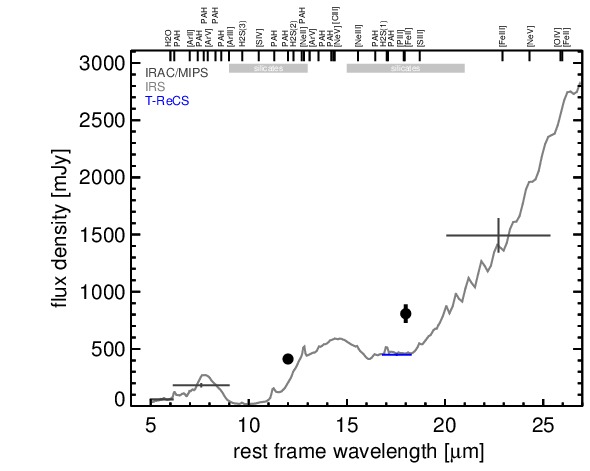
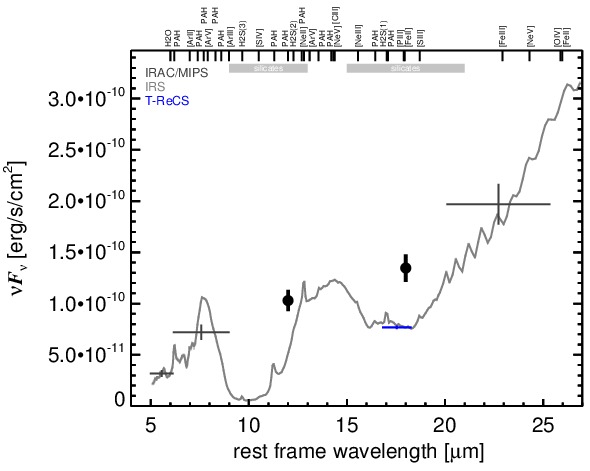
MIR SED. The description of the symbols in all the SED plots (where present) is the following: Grey crosses and solid lines mark the Spitzer/IRAC, MIPS and IRS data. The colour coding of the other symbols is as follows: green for COMICS, magenta for Michelle, blue for T-ReCS and red for VISIR data. Darker-coloured solid lines mark spectra of the corresponding instrument. The black filled circles mark the nuclear 12 and 18 micron continuum emission estimate from the data (where present). The ticks on the top axis mark positions of common MIR emission lines, while the light grey horizontal bars mark wavelength ranges affected by the silicate 10 and 18 micron features.