Sasmirala Individual Information for ESO 323-32
Description
ESO 323-32 is a spiral galaxy at a redshift of z = 0.0160 (D ~ 70.5 Mpc) hosting an AGN with optical Sy 1.9 classification [veron-cetty_catalogue_2010]. No Spitzer data are available for this object. We observed ESO 323-32 with VISIR in 2008 in four narrow N-band filters during one night. A compact MIR nucleus without any host emission was detected in the PAH1, PAH2 and NEII filter images but not in SIV, which indicates the presence of a deep silicate 10 μm absorption feature. The low S/N prevents us to perform an extension analyses of the source. Our new measurement of the nuclear flux in the PAH2 filter is a factor two lower than the previously published value in [gandhi_resolving_2009], which is due to the new measurement method optimized for low S/N.
- [gandhi_resolving_2009] P. Gandhi, H. Horst, A. Smette, S. Hönig, A. Comastri, R. Gilli, C. Vignali, and W. Duschl. Resolving the mid-infrared cores of local seyferts . A&A , 502 pp. 457–472, August 2009.
- [veron-cetty_catalogue_2010] M.-P. Véron-Cetty and P. Véron. A catalogue of quasars and active nuclei: 13th edition . A&A , 518 pp. 10, July 2010.
Images
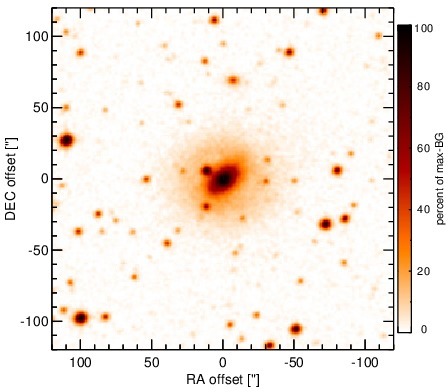
Optical image (DSS, red filter). Displayed are the central 4 arcmin with North being up and East to the left. The colour scaling is linear with white corresponding to the median background (BG) and black to the 0.01% pixels with the highest intensity.
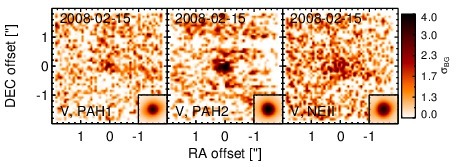
Subarcsecond-resolution MIR images sorted by increasing filter central wavelength. Displayed are the inner 4 arcsec with North being up and East to the left. The colour scaling is logarithmic with white corresponding to median BG and black to the 75% of the highest intensity of all images in units of sig_bg. The inset image (where present; either bottom or top right) shows the central arcsecond of the PSF from the calibrator star, scaled to match the science target. The labels in the bottom left state instrument and filter names (C: COMICS, M: Michelle, T: T-ReCS, V: VISIR).
SEDs
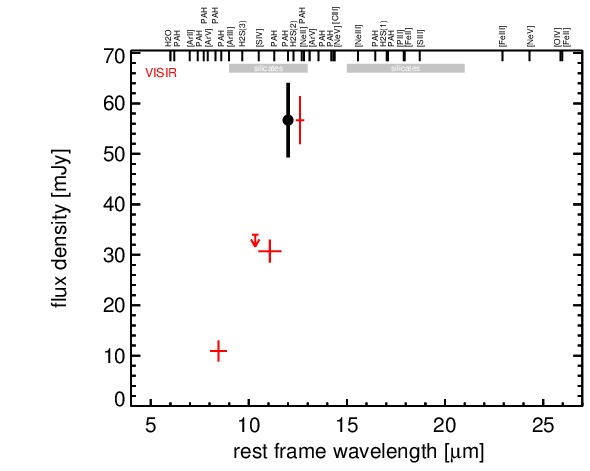
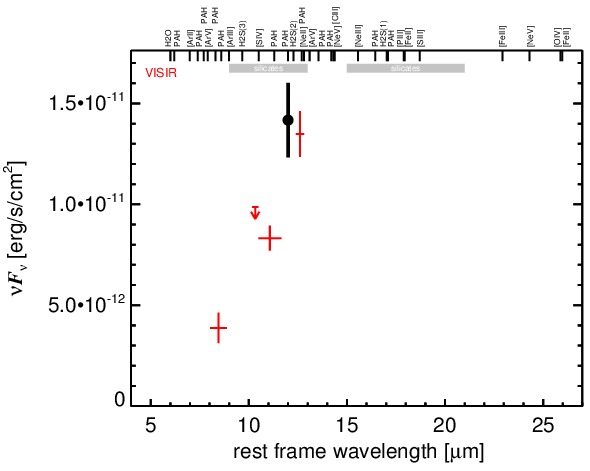
MIR SED. The description of the symbols in all the SED plots (where present) is the following: Grey crosses and solid lines mark the Spitzer/IRAC, MIPS and IRS data. The colour coding of the other symbols is as follows: green for COMICS, magenta for Michelle, blue for T-ReCS and red for VISIR data. Darker-coloured solid lines mark spectra of the corresponding instrument. The black filled circles mark the nuclear 12 and 18 micron continuum emission estimate from the data (where present). The ticks on the top axis mark positions of common MIR emission lines, while the light grey horizontal bars mark wavelength ranges affected by the silicate 10 and 18 micron features.