Sasmirala Individual Information for ESO 428-14
Description
ESO 428-14 is a spiral galaxy at a redshift of z = 0.0057 (D ~ 26 Mpc) close to the Galactic plane. It is hosting a Sy 2 nucleus [veron-cetty_catalogue_2010] and possesses a bended jet-like radio structure [ulvestad_radio_1989] aligned with a cone-like extended narrow-line region (PA~-50degre; [wilson_0714_1989, falcke_helical_1996]). ESO 428-14 was observed with Spitzer/IRAC, IRS and MIPS. The compact MIR nucleus detected in all images is embedded in weak extended host emission along the north-south direction visible in the IRAC 5.8 and 8.0 μm images. Two epochs of MIPS 24 μm images (2004 and 2006) are available. Our flux measurement of the nuclear source agrees with the value published in [temi_spitzer_2009]. The IRS LR staring-mode spectrum shows strong forbidden line emission, PAH features and silicate 10 μm absorption, indicating a star formation contribution (see also [shi_9.7_2006]). The MIR spectrum rises steeply and peaks around ~ 18 μm in νFν-space. We observed ESO 428-14 with VISIR in three narrow N-band and one Q-band filter during one night in 2007 and also obtained a VISIR N-band spectrum [honig_dusty_2010-1]. All images show a compact nuclear source embedded in increasingly prominent extended bar-like emission towards the longer wavelength filters. In the Q-band image (unpublished, to our knowledge), a knot ~ 1arcsec south-east of the nucleus becomes visible. The extended emission is oriented along the north-west direction (PA~ 140∘), aligned with the NLR emission and host galaxy major axis. The VISIR spectrum possesses the same continuum shape, silicate absorption and forbidden emission lines as the IRS spectrum. However, the continuum flux level is lower and the PAH emission is also absent, indicating that the subarcsecond scales do not have significant star formation contribution. While [honig_dusty_2010-1] have presented the VISIR spectrophotometry integrated over the inner 0.75arcsec, we now isolate the unresolved fluxes, which are significantly lower. In particular, the average subarcsecond nuclear fluxes are ~ 60% lower than the values of the Spitzer spectrophotometry.
- [falcke_helical_1996] Heino Falcke, Andrew S. Wilson, Chris Simpson, and Gary A. Bower. Helical strands in the jetlike narrow-line region of ESO 428-g14 . ApJL , 470 pp. L31, October 1996.
- [honig_dusty_2010-1] S. F. Hönig, M. Kishimoto, P. Gandhi, A. Smette, D. Asmus, W. Duschl, M. Polletta, and G. Weigelt. The dusty heart of nearby active galaxies. i. high-spatial resolution mid-IR spectro-photometry of seyfert galaxies . A&A , 515 pp. 23, June 2010.
- [shi_9.7_2006] Y. Shi, G. H. Rieke, D. C. Hines, V. Gorjian, M. W. Werner, K. Cleary, F. J. Low, P. S. Smith, and J. Bouwman. 9.7 μm silicate features in active galactic nuclei: New insights into unification models . ApJ , 653 pp. 127–136, December 2006.
- [temi_spitzer_2009] Pasquale Temi, Fabrizio Brighenti, and William G. Mathews. Spitzer observations of passive and star-forming early-type galaxies: An infrared color-color sequence . ApJ , 707 pp. 890–902, December 2009.
- [ulvestad_radio_1989] James S. Ulvestad and Andrew S. Wilson. Radio structures of seyfert galaxies. VII - extension of a distance-limited sample . ApJ , 343 pp. 659–671, August 1989.
- [veron-cetty_catalogue_2010] M.-P. Véron-Cetty and P. Véron. A catalogue of quasars and active nuclei: 13th edition . A&A , 518 pp. 10, July 2010.
- [wilson_0714_1989] A. S. Wilson and J. A. Baldwin. 0714 - 2914 (m4-1) - another seyfert galaxy with aligned radio continuum and optical emission-line morphologies . AJ , 98 pp. 2056–2061, December 1989.
Images
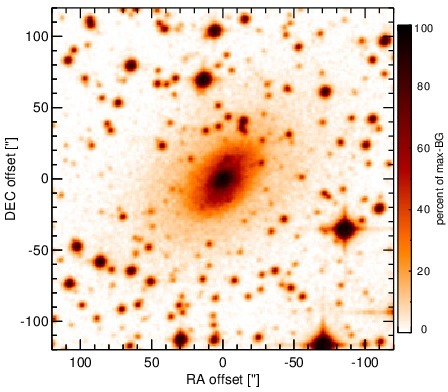
Optical image (DSS, red filter). Displayed are the central 4 arcmin with North being up and East to the left. The colour scaling is linear with white corresponding to the median background (BG) and black to the 0.01% pixels with the highest intensity.
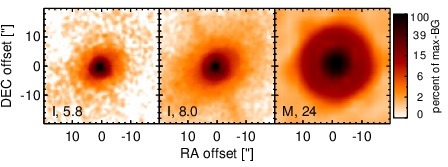
Spitzer MIR images. Displayed are the inner 40 arcsec with North being up and East to the left. The colour scaling is logarithmic with white corresponding to median BG and black to the 0.1% pixels with the highest intensity. The label in the bottom left states instrument and central wavelength of the filter in micron (I: IRAC, M: MIPS).
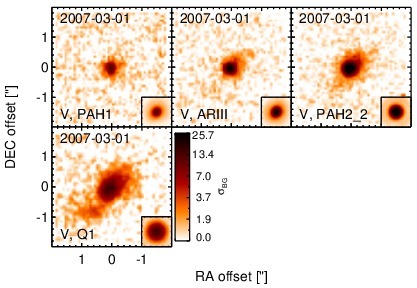
Subarcsecond-resolution MIR images sorted by increasing filter central wavelength. Displayed are the inner 4 arcsec with North being up and East to the left. The colour scaling is logarithmic with white corresponding to median BG and black to the 75% of the highest intensity of all images in units of sig_bg. The inset image (where present; either bottom or top right) shows the central arcsecond of the PSF from the calibrator star, scaled to match the science target. The labels in the bottom left state instrument and filter names (C: COMICS, M: Michelle, T: T-ReCS, V: VISIR).
SEDs
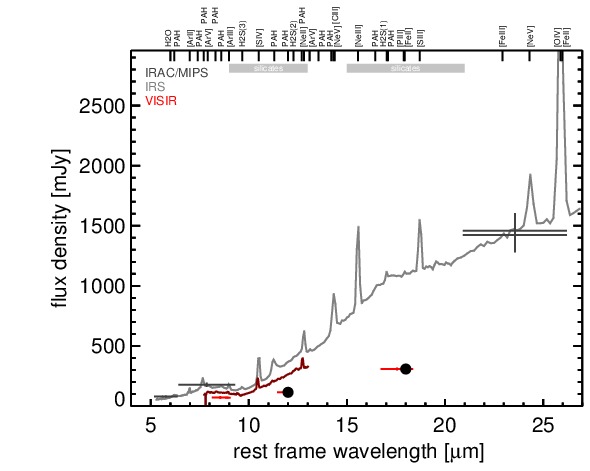
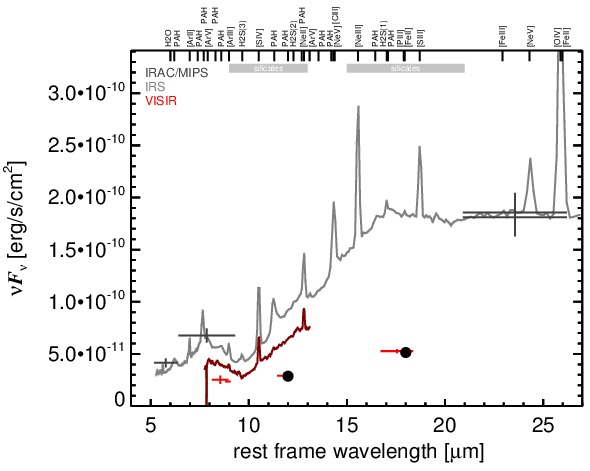
MIR SED. The description of the symbols in all the SED plots (where present) is the following: Grey crosses and solid lines mark the Spitzer/IRAC, MIPS and IRS data. The colour coding of the other symbols is as follows: green for COMICS, magenta for Michelle, blue for T-ReCS and red for VISIR data. Darker-coloured solid lines mark spectra of the corresponding instrument. The black filled circles mark the nuclear 12 and 18 micron continuum emission estimate from the data (where present). The ticks on the top axis mark positions of common MIR emission lines, while the light grey horizontal bars mark wavelength ranges affected by the silicate 10 and 18 micron features.