Sasmirala Individual Information for ESO 548-81
Description
ESO 548-81 is a face-on spiral galaxy at a redshift of z = 0.0145 (D ~ 58.6 Mpc) hosting a Sy 1 nucleus [veron-cetty_catalogue_2010] that belongs to the nine-month BAT AGN sample. It was observed with Spitzer/IRS, and the LR staring-mode spectrum shows prominent silicate 10 and 18 μm emission (see also [mullaney_defining_2011]). The general MIR spectral slope is blue in νFν-space. We observed ESO 548-81 with VISIR in three narrow N-band filters in one night of 2009 and detected a compact MIR nucleus without any sign of extended host emission. The nucleus appears marginally resolved in all images (FWHM ~ 0.37arcsec ~ 100 pc) but at least a second epoch is needed to confirm this extension. The VISIR photometric measurements are consistent with the IRS spectrum, but they would be significantly lower if the presence of subarcsecond-extended emission can be verified.
- [mullaney_defining_2011] J. R. Mullaney, D. M. Alexander, A. D. Goulding, and R. C. Hickox. Defining the intrinsic AGN infrared spectral energy distribution and measuring its contribution to the infrared output of composite galaxies . MNRAS , page 474, April 2011.
- [veron-cetty_catalogue_2010] M.-P. Véron-Cetty and P. Véron. A catalogue of quasars and active nuclei: 13th edition . A&A , 518 pp. 10, July 2010.
Images
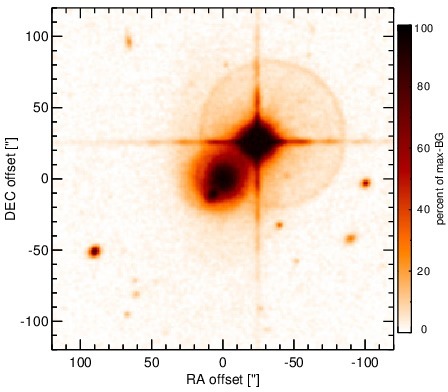
Optical image (DSS, red filter). Displayed are the central 4 arcmin with North being up and East to the left. The colour scaling is linear with white corresponding to the median background (BG) and black to the 0.01% pixels with the highest intensity.
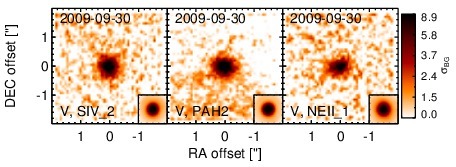
Subarcsecond-resolution MIR images sorted by increasing filter central wavelength. Displayed are the inner 4 arcsec with North being up and East to the left. The colour scaling is logarithmic with white corresponding to median BG and black to the 75% of the highest intensity of all images in units of sig_bg. The inset image (where present; either bottom or top right) shows the central arcsecond of the PSF from the calibrator star, scaled to match the science target. The labels in the bottom left state instrument and filter names (C: COMICS, M: Michelle, T: T-ReCS, V: VISIR).
SEDs
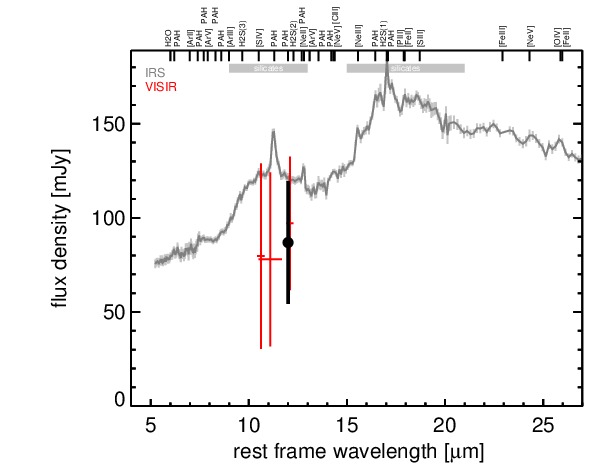
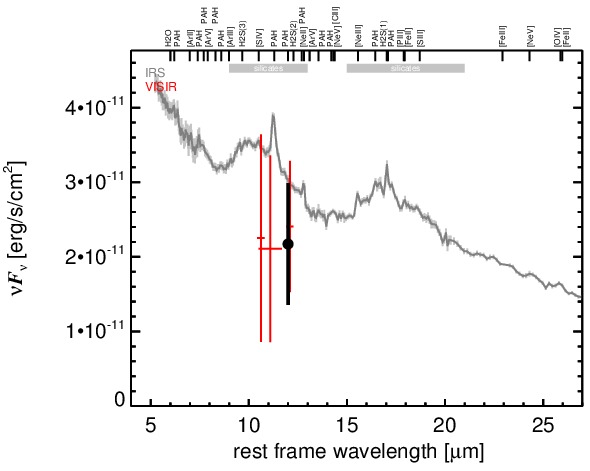
MIR SED. The description of the symbols in all the SED plots (where present) is the following: Grey crosses and solid lines mark the Spitzer/IRAC, MIPS and IRS data. The colour coding of the other symbols is as follows: green for COMICS, magenta for Michelle, blue for T-ReCS and red for VISIR data. Darker-coloured solid lines mark spectra of the corresponding instrument. The black filled circles mark the nuclear 12 and 18 micron continuum emission estimate from the data (where present). The ticks on the top axis mark positions of common MIR emission lines, while the light grey horizontal bars mark wavelength ranges affected by the silicate 10 and 18 micron features.