Sasmirala Individual Information for ESO 602-25
Description
ESO 602-25 is an infrared-luminous spiral galaxy at a redshift of z = 0.025 (D ~ 100 Mpc) with an active nucleus optically classified either as a H II or Sy 2 [veron_agns_1997], LINER [kim_optical_1995, veilleux_optical_1995] or a AGN/starburst composite [yuan_role_2010]. Because we are not aware of any AGN evidence from other than optical wavelengths we treat it as uncertain AGN/starburst composite. Spitzer/IRAC, IRS and MIPS observations are available, and a compact nucleus embedded within extended host emission is visible in the IRAC 5.8 and 8.0 μm and MIPS 24 μm images. Thus, our photometry of the nuclear component alone provides lower values than published in [u_spectral_2012]. The IRS LR staring-mode spectrum is dominated by star formation with strong PAH emission, silicate absorption and a red spectral slope in νFν-space (see also [sargsyan_infrared_2011]). ESO 602-25 was imaged with T-ReCS in the Qa filter in 2009 [imanishi_subaru_2011]. The MIR nucleus was weakly detected and consists of an unresolved component embedded within emission with a north-south ~ 2arcsec (~ 0.9 kpc) extent coinciding with the host major axis. Thus, our measured flux of the unresolved nuclear component is significantly lower than the total flux value of [imanishi_subaru_2011], and 86% lower than Spitzer spectrophotometry. These results indicate that an AGN embedded within intense star formation might indeed be present in ESO 602-25. We extrapolate from the Qa measurement towards shorter wavelengths in order to compute the nuclear 12 μm continuum emission estimate as described in Sect. 4.3.
- [imanishi_subaru_2011] Masatoshi Imanishi, Keisuke Imase, Nagisa Oi, and Kohei Ichikawa. Subaru and gemini high spatial resolution infrared 18 μm imaging observations of nearby luminous infrared galaxies . AJ , 141 pp. 156, May 2011.
- [kim_optical_1995] D.-C. Kim, D. B. Sanders, S. Veilleux, J. M. Mazzarella, and B. T. Soifer. Optical spectroscopy of luminous infrared galaxies. i. nuclear data . ApJS , 98 pp. 129, May 1995.
- [sargsyan_infrared_2011] Lusine Sargsyan, Daniel Weedman, Vianney Lebouteiller, James Houck, Donald Barry, Ashot Hovhannisyan, and Areg Mickaelian. Infrared spectra and spectral energy distributions for dusty starbursts and active galactic nuclei . ApJ , 730 pp. 19, March 2011.
- [u_spectral_2012] Vivian U, D. B. Sanders, J. M. Mazzarella, A. S. Evans, J. H. Howell, J. A. Surace, L. Armus, K. Iwasawa, D.-C. Kim, C. M. Casey, T. Vavilkin, M. Dufault, K. L. Larson, J. E. Barnes, B. H. P. Chan, D. T. Frayer, S. Haan, H. Inami, C. M. Ishida, J. S. Kartaltepe, J. L. Melbourne, and A. O. Petric. Spectral energy distributions of local luminous and ultraluminous infrared galaxies . ApJS , 203 pp. 9, November 2012.
- [veilleux_optical_1995] S. Veilleux, D.-C. Kim, D. B. Sanders, J. M. Mazzarella, and B. T. Soifer. Optical spectroscopy of luminous infrared galaxies. II. analysis of the nuclear and long-slit data . ApJS , 98 pp. 171, May 1995.
- [veron_agns_1997] P. Veron, A. C. Goncalves, and M.-P. Veron-Cetty. AGNs with composite spectra. . A&A , 319 pp. 52–66, March 1997.
- [yuan_role_2010] T.-T. Yuan, L. J. Kewley, and D. B. Sanders. The role of starburst-active galactic nucleus composites in luminous infrared galaxy mergers: Insights from the new optical classification scheme . ApJ , 709 pp. 884–911, February 2010.
Images
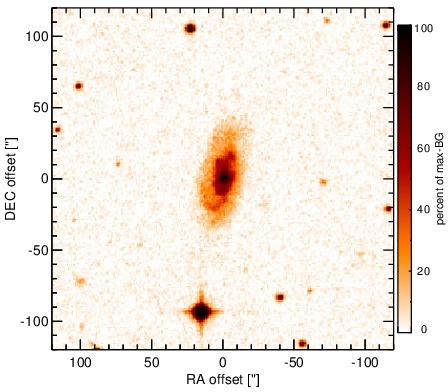
Optical image (DSS, red filter). Displayed are the central 4 arcmin with North being up and East to the left. The colour scaling is linear with white corresponding to the median background (BG) and black to the 0.01% pixels with the highest intensity.
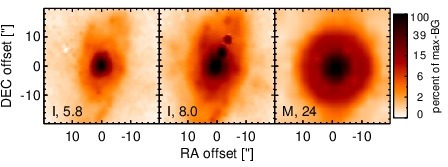
Spitzer MIR images. Displayed are the inner 40 arcsec with North being up and East to the left. The colour scaling is logarithmic with white corresponding to median BG and black to the 0.1% pixels with the highest intensity. The label in the bottom left states instrument and central wavelength of the filter in micron (I: IRAC, M: MIPS).
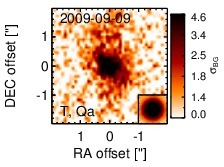
Subarcsecond-resolution MIR images sorted by increasing filter central wavelength. Displayed are the inner 4 arcsec with North being up and East to the left. The colour scaling is logarithmic with white corresponding to median BG and black to the 75% of the highest intensity of all images in units of sig_bg. The inset image (where present; either bottom or top right) shows the central arcsecond of the PSF from the calibrator star, scaled to match the science target. The labels in the bottom left state instrument and filter names (C: COMICS, M: Michelle, T: T-ReCS, V: VISIR).
SEDs
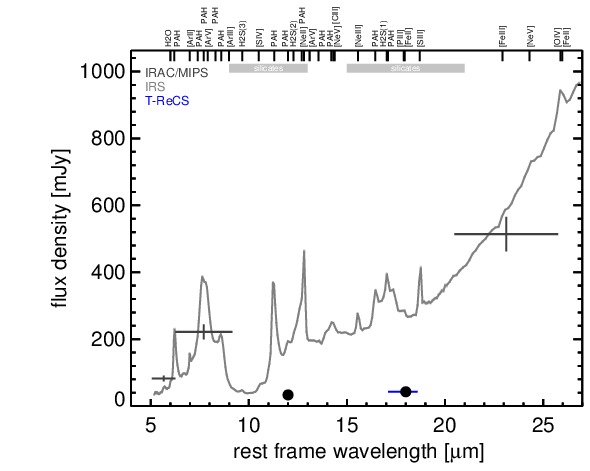
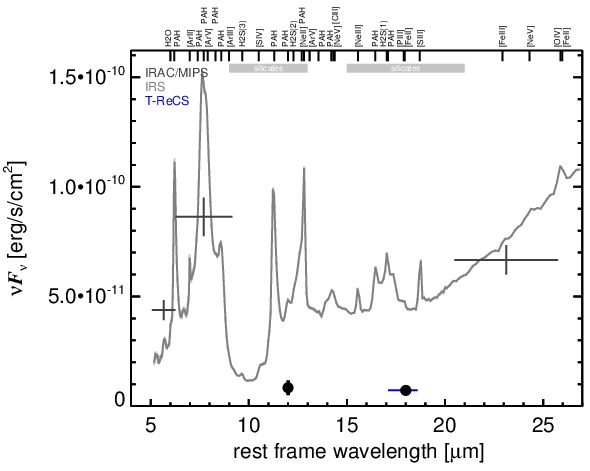
MIR SED. The description of the symbols in all the SED plots (where present) is the following: Grey crosses and solid lines mark the Spitzer/IRAC, MIPS and IRS data. The colour coding of the other symbols is as follows: green for COMICS, magenta for Michelle, blue for T-ReCS and red for VISIR data. Darker-coloured solid lines mark spectra of the corresponding instrument. The black filled circles mark the nuclear 12 and 18 micron continuum emission estimate from the data (where present). The ticks on the top axis mark positions of common MIR emission lines, while the light grey horizontal bars mark wavelength ranges affected by the silicate 10 and 18 micron features.