Sasmirala Individual Information for Fairall 51
Description
Fairall 51 is a barred spiral galaxy at a distance of D = 64.1 Mpc ([springob_erratum:_2009]; z = 0.0142) hosting an AGN with optical Sy 1.5 classification [veron-cetty_catalogue_2010]. Its extended narrow line region is aligned with the major axis of the galaxy [schmitt_hubble_2003] and shows the same extinction as the broad-line region, indicating dust in the foreground [bennert_size_2006]. The first N-band photometry of Fairall 51 was carried out by [glass_mid-infrared_1982] with the ESO infrared photometer system at the 3 m telescope. Since then, it was observed with Spitzer/IRS in LR staring mode. The MIR spectrum displays silicate 10 and 18 μm emission and PAH emission with a rather flat spectral slope in νFν-space (see also [sargsyan_infrared_2011]). The only subarcsecond MIR observation of Fairall 51 was carried out with T-ReCS in a Q-band filter in 2007 (unpublished, to our knowledge). A compact MIR nucleus was detected without any extended host emission. Our photometry measurement agrees with the flux level of IRS spectrum and thus we use the latter to compute the nuclear 12 μm continuum emission estimate.
- [bennert_size_2006] N. Bennert, B. Jungwiert, S. Komossa, M. Haas, and R. Chini. Size and properties of the NLR in the seyfert-2 galaxy NGC 1386 . A&A , 446 pp. 919–932, February 2006.
- [glass_mid-infrared_1982] I. S. Glass, A. F. M. Moorwood, and W. Eichendorf. Mid-infrared observations of seyfert 1 and narrow-line x-ray galaxies . A&A , 107 pp. 276–282, March 1982.
- [sargsyan_infrared_2011] Lusine Sargsyan, Daniel Weedman, Vianney Lebouteiller, James Houck, Donald Barry, Ashot Hovhannisyan, and Areg Mickaelian. Infrared spectra and spectral energy distributions for dusty starbursts and active galactic nuclei . ApJ , 730 pp. 19, March 2011.
- [schmitt_hubble_2003] H. R. Schmitt, J. L. Donley, R. R. J. Antonucci, J. B. Hutchings, and A. L. Kinney. A hubble space telescope survey of extended [o III] λ5007 emission in a far-infrared selected sample of seyfert galaxies: Observations . ApJS , 148 pp. 327–352, October 2003.
- [springob_erratum:_2009] Christopher M. Springob, Karen L. Masters, Martha P. Haynes, Riccardo Giovanelli, and Christian Marinoni. Erratum: "SFI++ II: a new i-band tully-fisher catalog, derivation of peculiar velocities and data set properties" (2007, ApJS, 172, 599) . ApJS , 182 pp. 474–475, May 2009.
- [veron-cetty_catalogue_2010] M.-P. Véron-Cetty and P. Véron. A catalogue of quasars and active nuclei: 13th edition . A&A , 518 pp. 10, July 2010.
Images
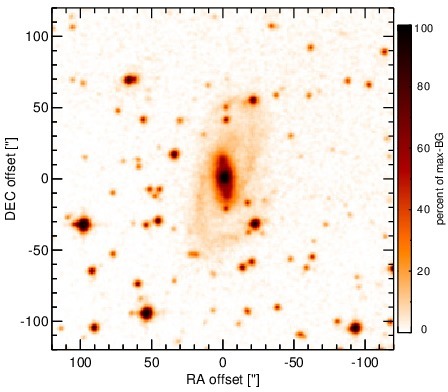
Optical image (DSS, red filter). Displayed are the central 4 arcmin with North being up and East to the left. The colour scaling is linear with white corresponding to the median background (BG) and black to the 0.01% pixels with the highest intensity.
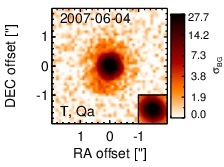
Subarcsecond-resolution MIR images sorted by increasing filter central wavelength. Displayed are the inner 4 arcsec with North being up and East to the left. The colour scaling is logarithmic with white corresponding to median BG and black to the 75% of the highest intensity of all images in units of sig_bg. The inset image (where present; either bottom or top right) shows the central arcsecond of the PSF from the calibrator star, scaled to match the science target. The labels in the bottom left state instrument and filter names (C: COMICS, M: Michelle, T: T-ReCS, V: VISIR).
SEDs
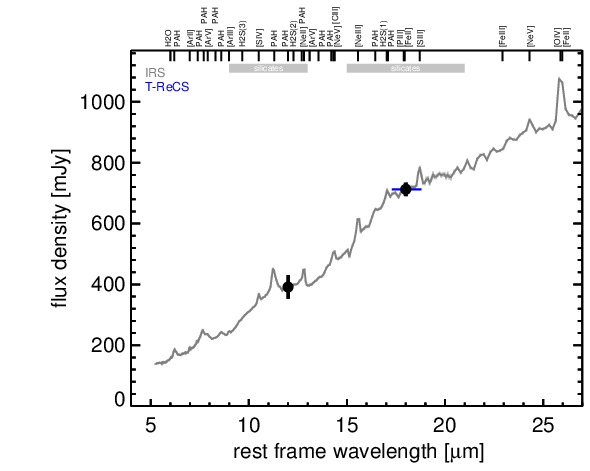
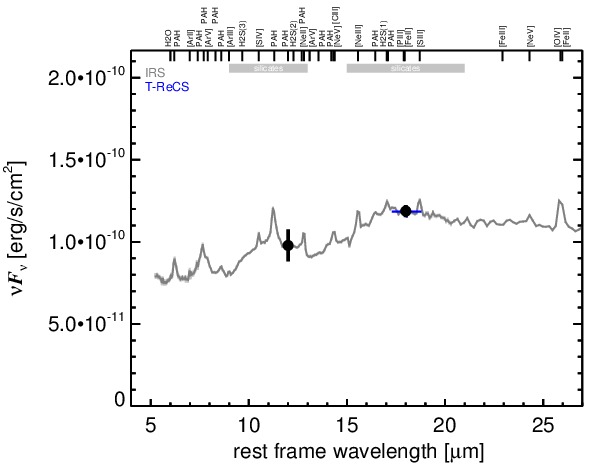
MIR SED. The description of the symbols in all the SED plots (where present) is the following: Grey crosses and solid lines mark the Spitzer/IRAC, MIPS and IRS data. The colour coding of the other symbols is as follows: green for COMICS, magenta for Michelle, blue for T-ReCS and red for VISIR data. Darker-coloured solid lines mark spectra of the corresponding instrument. The black filled circles mark the nuclear 12 and 18 micron continuum emission estimate from the data (where present). The ticks on the top axis mark positions of common MIR emission lines, while the light grey horizontal bars mark wavelength ranges affected by the silicate 10 and 18 micron features.