Sasmirala Individual Information for Fornax A
Description
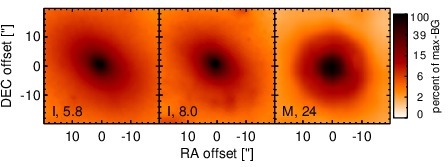
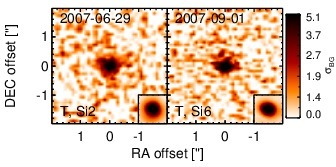
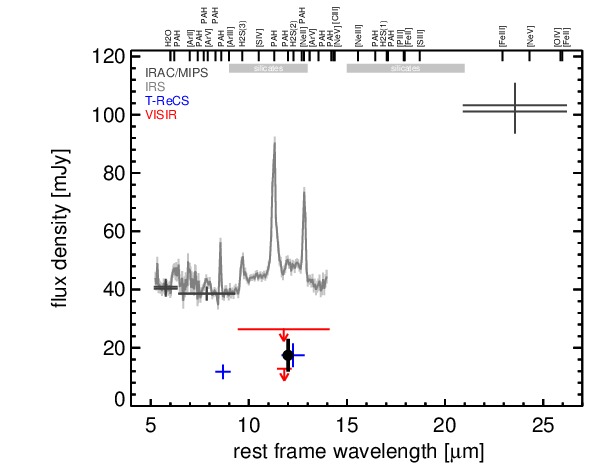
Fornax A is a FR I-like radio source coinciding with the peculiar galaxy NGC 1316 at a distance of D = ~ 19 Mpc (NED redshift-independent median). It contains a LINER-like nucleus [bregman_o_2005] and features large diffuse radio lobes. There are various indications for Fornax A being a merger remnant [schweizer_optical_1980, goudfrooij_star_2001] with powerful nuclear activity until relatively recently [iyomoto_declined_1998]. The first N-band observations of Fornax A were carried out by [rieke_infrared_1978] and [sparks_infrared_1986], and later by [xilouris_dust_2004] with ISO/ISOCAM. Since then, it was also observed with Spitzer/IRAC, IRS and MIPS. In the IRAC 5.8 and 8.0 μm and MIPS 24 μm images, an extended elliptical structure was detected in the nucleus (major axis in the north-east direction) with perpendicularly extended weak emission (see also [temi_ages_2005, lanz_constraining_2010]). Our nuclear IRAC 5.8 and 8.0 μm and MIPS 24 μm photometry yields significantly lower fluxes than the global flux measurements of [dale_infrared_2005] and [munoz-mateos_radial_2009], and significantly higher values than those from the nuclear decomposition performed by [lanz_constraining_2010]. Owing to this complex extended MIR structure, the PBCD IRS LR mapping-mode spectrum is mostly unusable (see [smith_mid-infrared_2007, dale_spitzer_2009] for a proper spectrum). We show only the short-wavelength part, which indicates silicate 10 μm and PAH emission. Fornax A was observed at subarcsecond resolution with VISIR in the broad N-band filter SIC in 2006 and PAH2_2 in 2009, and the nucleus remained undetected on both occasions. The SIC measurement was analysed by [van_der_wolk_dust_2010] obtaining a much lower upper limit than we derive from the same data. In addition, Fornax A was observed with T-ReCS in two N-band filters in 2007 where a compact MIR nucleus was weakly detected (unpublished, to our knowledge). The nucleus appears possibly resolved (FWHM(major axis) ~ 0.6arcsec ~ 55 pc; PA~ 90∘). However, the S/N is very low and a second epoch is necessary to verify this extension. The measured nuclear fluxes are on average ~ 63% lower than the Spitzer spectrophotometry and consistent with our VISIR SIC upper limit but not with the PAH2_2 upper limit, for unknown reasons.
- [bregman_o_2005] Joel N. Bregman, Eric D. Miller, Alex E. Athey, and Jimmy A. Irwin. O VI in elliptical galaxies: Indicators of cooling flows . ApJ , 635 pp. 1031–1043, December 2005.
- [dale_infrared_2005] D. A. Dale, G. J. Bendo, C. W. Engelbracht, K. D. Gordon, M. W. Regan, L. Armus, J. M. Cannon, D. Calzetti, B. T. Draine, G. Helou, R. D. Joseph, R. C. Kennicutt, A. Li, E. J. Murphy, H. Roussel, F. Walter, H. M. Hanson, D. J. Hollenbach, T. H. Jarrett, L. J. Kewley, C. A. Lamanna, C. Leitherer, M. J. Meyer, G. H. Rieke, M. J. Rieke, K. Sheth, J. D. T. Smith, and M. D. Thornley. Infrared spectral energy distributions of nearby galaxies . ApJ , 633 pp. 857–870, November 2005.
- [dale_spitzer_2009] D. A. Dale, J. D. T. Smith, E. A. Schlawin, L. Armus, B. A. Buckalew, S. A. Cohen, G. Helou, T. H. Jarrett, L. C. Johnson, J. Moustakas, E. J. Murphy, H. Roussel, K. Sheth, S. Staudaher, C. Bot, D. Calzetti, C. W. Engelbracht, K. D. Gordon, D. J. Hollenbach, R. C. Kennicutt, and S. Malhotra. The spitzer infrared nearby galaxies survey: A high-resolution spectroscopy anthology . ApJ , 693 pp. 1821–1834, March 2009.
- [goudfrooij_star_2001] Paul Goudfrooij, M. Victoria Alonso, Claudia Maraston, and Dante Minniti. The star cluster system of the 3-gyr-old merger remnant NGC 1316: clues from optical and near-infrared photometry . MNRAS , 328 pp. 237–256, November 2001.
- [iyomoto_declined_1998] Naoko Iyomoto, Kazuo Makishima, Makoto Tashiro, Susumu Inoue, Hidehiro Kaneda, Yukari Matsumoto, and Tsunefumi Mizuno. The declined activity in the nucleus of NGC 1316 . ApJL , 503 pp. L31, August 1998.
- [lanz_constraining_2010] Lauranne Lanz, Christine Jones, William R. Forman, Matthew L. N. Ashby, Ralph Kraft, and Ryan C. Hickox. Constraining the outburst properties of the SMBH in fornax a through x-ray, infrared, and radio observations . ApJ , 721 pp. 1702–1713, October 2010.
- [munoz-mateos_radial_2009] J. C. Muñoz-Mateos, A. Gil de Paz, J. Zamorano, S. Boissier, D. A. Dale, P. G. Pérez-González, J. Gallego, B. F. Madore, G. Bendo, A. Boselli, V. Buat, D. Calzetti, J. Moustakas, and R. C. Kennicutt. Radial distribution of stars, gas, and dust in SINGS galaxies. i. surface photometry and morphology . ApJ , 703 pp. 1569–1596, October 2009.
- [rieke_infrared_1978] G. H. Rieke. The infrared emission of seyfert galaxies . ApJ , 226 pp. 550–558, December 1978.
- [schweizer_optical_1980] F. Schweizer. An optical study of the giant radio galaxy NGC 1316 /Fornax a/ . ApJ , 237 pp. 303–318, April 1980.
- [smith_mid-infrared_2007] J. D. T. Smith, B. T. Draine, D. A. Dale, J. Moustakas, R. C. Kennicutt, G. Helou, L. Armus, H. Roussel, K. Sheth, G. J. Bendo, B. A. Buckalew, D. Calzetti, C. W. Engelbracht, K. D. Gordon, D. J. Hollenbach, A. Li, S. Malhotra, E. J. Murphy, and F. Walter. The mid-infrared spectrum of star-forming galaxies: Global properties of polycyclic aromatic hydrocarbon emission . ApJ , 656 pp. 770–791, February 2007.
- [sparks_infrared_1986] W. B. Sparks, J. H. Hough, D. J. Axon, and J. Bailey. Infrared photometry of the nuclei of early-type radio galaxies . MNRAS , 218 pp. 429–444, February 1986.
- [temi_ages_2005] Pasquale Temi, William G. Mathews, and Fabrizio Brighenti. The ages of elliptical galaxies from mid-infrared emission . ApJ , 622 pp. 235–243, March 2005.
- [van_der_wolk_dust_2010] G. van der Wolk, P. D. Barthel, R. F. Peletier, and J. W. Pel. Dust tori in radio galaxies . A&A , 511 pp. 64, February 2010.
- [xilouris_dust_2004] E. M. Xilouris, S. C. Madden, F. Galliano, L. Vigroux, and M. Sauvage. Dust emission in early-type galaxies: The mid-infrared view . A&A , 416 pp. 41–55, March 2004.
Images

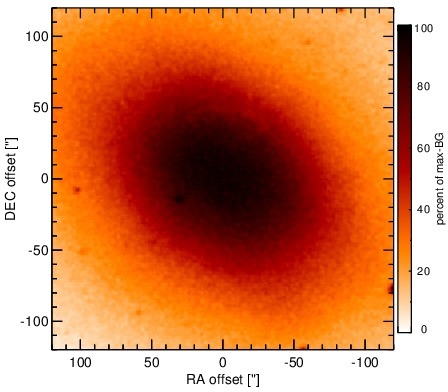
Optical image (DSS, red filter). Displayed are the central 4 arcmin with North being up and East to the left. The colour scaling is linear with white corresponding to the median background (BG) and black to the 0.01% pixels with the highest intensity.

Spitzer MIR images. Displayed are the inner 40 arcsec with North being up and East to the left. The colour scaling is logarithmic with white corresponding to median BG and black to the 0.1% pixels with the highest intensity. The label in the bottom left states instrument and central wavelength of the filter in micron (I: IRAC, M: MIPS).

Subarcsecond-resolution MIR images sorted by increasing filter central wavelength. Displayed are the inner 4 arcsec with North being up and East to the left. The colour scaling is logarithmic with white corresponding to median BG and black to the 75% of the highest intensity of all images in units of sig_bg. The inset image (where present; either bottom or top right) shows the central arcsecond of the PSF from the calibrator star, scaled to match the science target. The labels in the bottom left state instrument and filter names (C: COMICS, M: Michelle, T: T-ReCS, V: VISIR).
SEDs


MIR SED. The description of the symbols in all the SED plots (where present) is the following: Grey crosses and solid lines mark the Spitzer/IRAC, MIPS and IRS data. The colour coding of the other symbols is as follows: green for COMICS, magenta for Michelle, blue for T-ReCS and red for VISIR data. Darker-coloured solid lines mark spectra of the corresponding instrument. The black filled circles mark the nuclear 12 and 18 micron continuum emission estimate from the data (where present). The ticks on the top axis mark positions of common MIR emission lines, while the light grey horizontal bars mark wavelength ranges affected by the silicate 10 and 18 micron features.