Sasmirala Individual Information for Hydra A
Description
Hydra A is a FR I radio source coinciding with the early-type galaxy MCG-2-24-7 at a redshift of z = 0.0549 (D ~ 240 Mpc) with a LINER nucleus [veron-cetty_catalogue_2010]. The first MIR detection of Hydra A was with Spitzer/MIPS [shi_far-infrared_2005]. Our photometric measurement of the MIPS 24 μm matches their published fluxes. It was also observed with Spitzer/IRAC and IRS. In the IRAC 8 μm image, the elliptical host galaxy emission is weakly detected. In addition, the nuclear source appears elongated in east-south-east direction. The low S/N IRS LR staring-mode spectrum shows silicate 10 μm absorption and PAH emission, i.e., star formation (see also [shi_9.7_2006]). In fact, [leipski_spitzer_2009] argue that the MIR SED of this object can be explained with pure star formation and no AGN contribution. Hydra A remained undetected in the VISIR PAH1 observation and the derived flux upper limit is lower than, but still consistent with, the Spitzer data.
- [leipski_spitzer_2009] C. Leipski, R. Antonucci, P. Ogle, and D. Whysong. The spitzer view of FR i radio galaxies: On the origin of the nuclear mid-infrared continuum . ApJ , 701 pp. 891–914, August 2009.
- [shi_9.7_2006] Y. Shi, G. H. Rieke, D. C. Hines, V. Gorjian, M. W. Werner, K. Cleary, F. J. Low, P. S. Smith, and J. Bouwman. 9.7 μm silicate features in active galactic nuclei: New insights into unification models . ApJ , 653 pp. 127–136, December 2006.
- [shi_far-infrared_2005] Y. Shi, G. H. Rieke, D. C. Hines, G. Neugebauer, M. Blaylock, J. Rigby, E. Egami, K. D. Gordon, and A. Alonso-Herrero. Far-infrared observations of radio quasars and FR II radio galaxies . ApJ , 629 pp. 88–99, August 2005.
- [veron-cetty_catalogue_2010] M.-P. Véron-Cetty and P. Véron. A catalogue of quasars and active nuclei: 13th edition . A&A , 518 pp. 10, July 2010.
Images
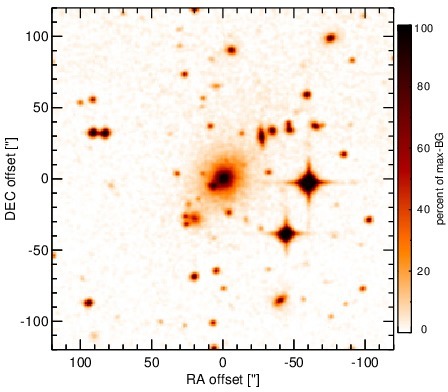
Optical image (DSS, red filter). Displayed are the central 4 arcmin with North being up and East to the left. The colour scaling is linear with white corresponding to the median background (BG) and black to the 0.01% pixels with the highest intensity.
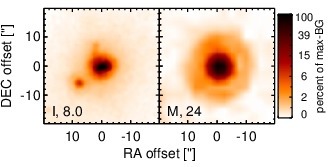
Spitzer MIR images. Displayed are the inner 40 arcsec with North being up and East to the left. The colour scaling is logarithmic with white corresponding to median BG and black to the 0.1% pixels with the highest intensity. The label in the bottom left states instrument and central wavelength of the filter in micron (I: IRAC, M: MIPS).
SEDs
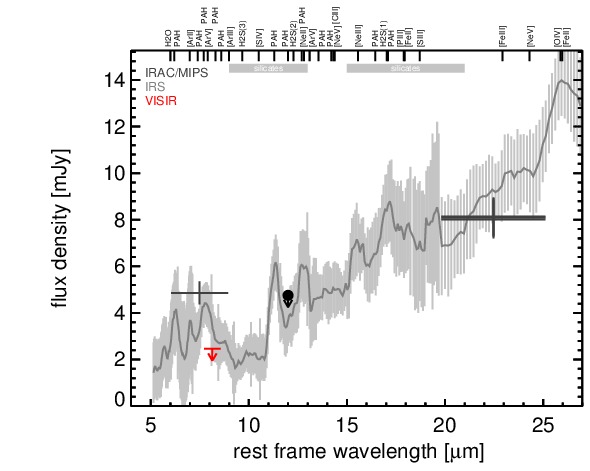
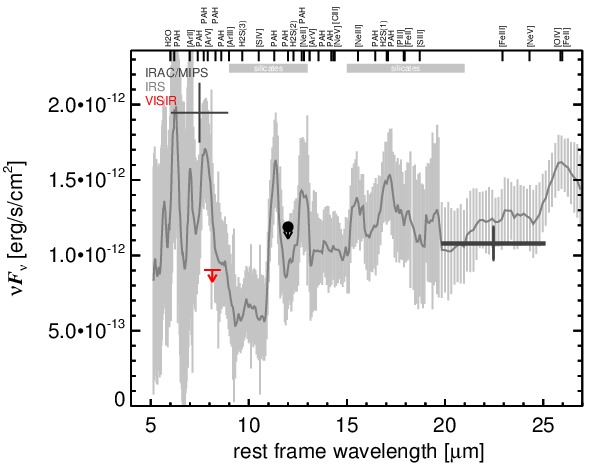
MIR SED. The description of the symbols in all the SED plots (where present) is the following: Grey crosses and solid lines mark the Spitzer/IRAC, MIPS and IRS data. The colour coding of the other symbols is as follows: green for COMICS, magenta for Michelle, blue for T-ReCS and red for VISIR data. Darker-coloured solid lines mark spectra of the corresponding instrument. The black filled circles mark the nuclear 12 and 18 micron continuum emission estimate from the data (where present). The ticks on the top axis mark positions of common MIR emission lines, while the light grey horizontal bars mark wavelength ranges affected by the silicate 10 and 18 micron features.