Sasmirala Individual Information for I Zw 1
Description
I Zw 1 is a compact spiral galaxy at a redshift of z = 0.0589 (D ~ 248 Mpc) with a Sy 1n nucleus [veron-cetty_catalogue_2010], and a nuclear starburst ring [schinnerer_molecular_1998, sosa-brito_integral_2001]. Early MIR observation of this object were carried out by [rieke_infrared_1972],[rieke_infrared_1978], [lebofsky_extinction_1979], [roche_8-13_1984],[sanders_continuum_1989], [elvis_atlas_1994], and [haas_dust_2000]. In addition, the source was monitored over the J to N bands with approximately yearly coverage from 1987 to 1998 and no significant variability was found [neugebauer_variability_1999]. The first sub-arcsecond resolution N-band imaging of I Zw 1 was carried out with Palomar 5 m/MIRLIN in 1999 [gorjian_10_2004], Keck/LWS in 2000 [soifer_high_2004], and ESO 3.6 m/TIMMI2 in 2001 [galliano_mid-infrared_2005]. In all cases an unresolved MIR nucleus without any host emission was detected, which is also the case for the Spitzer/IRAC 5.8 μm and MIPS 24 μm images. The Spitzer/IRS LR staring-mode spectrum exhibits prominent silicate 10 and 18 μm emission, no significant PAH emission and a flat spectral slope in νFν-space (see also [hao_detection_2005, weedman_mid-infrared_2005, schweitzer_extended_2008]). The absence of the PAH emission is surprising with respect to the scenario of a nuclear starburst ring in I Zw 1. Subarcsecond-resolution N-band observation were performed with COMICS in the N11.7 filter in 2006 [imanishi_subaru_2011] and with VISIR in two narrow N-band filters in 2010 (unpublished, to our knowledge). None of observations was carried out under diffraction-limited conditions, and in particular the N11.7 image suffers from PSF instability. However, the nucleus appears very compact in the ARIII acquisition image for which, unfortunately, no appropriate standard star observation is available. We adopt the nucleus to be unresolved as also found in the previous sub-arcsecond diffraction-limited observations mentioned above, and use the total Gaussian measurements for the nuclear flux. Note that our N11.7 flux is significantly higher than the value in [imanishi_subaru_2011] (probably owing to the issue above) but consistent with the VISIR measurements and the Spitzer spectrophotometry. Note that I Zw 1 was partially resolved in MIR interferometric observations with MIDI but with a dominating unresolved component smaller than 2.7 pc [burtscher_diversity_2013].
- [burtscher_diversity_2013] L. Burtscher, K. Meisenheimer, K. R. W. Tristram, W. Jaffe, S. F. Hönig, R. I. Davies, M. Kishimoto, J.-U. Pott, H. Röttgering, M. Schartmann, G. Weigelt, and S. Wolf. A diversity of dusty AGN tori. data release for the VLTI/MIDI AGN large program and first results for 23 galaxies . A&A , 558 pp. 149, October 2013.
- [elvis_atlas_1994] Martin Elvis, Belinda J. Wilkes, Jonathan C. McDowell, Richard F. Green, Jill Bechtold, S. P. Willner, M. S. Oey, Elisha Polomski, and Roc Cutri. Atlas of quasar energy distributions . ApJS , 95 pp. 1–68, November 1994.
- [galliano_mid-infrared_2005] E. Galliano, D. Alloin, E. Pantin, P. O. Lagage, and O. Marco. Mid-infrared imaging of active galaxies. active nuclei and embedded star clusters . A&A , 438 pp. 803–820, August 2005.
- [gorjian_10_2004] V. Gorjian, M. W. Werner, T. H. Jarrett, D. M. Cole, and M. E. Ressler. 10 micron imaging of seyfert galaxies from the 12 micron sample . ApJ , 605 pp. 156–167, April 2004.
- [haas_dust_2000] M. Haas, S. A. H. Müller, R. Chini, K. Meisenheimer, U. Klaas, D. Lemke, E. Kreysa, and M. Camenzind. Dust in PG quasars as seen by ISO . A&A , 354 pp. 453–466, February 2000.
- [hao_detection_2005] Lei Hao, H. W. W. Spoon, G. C. Sloan, J. A. Marshall, L. Armus, A. G. G. M. Tielens, B. Sargent, I. M. van Bemmel, V. Charmandaris, D. W. Weedman, and J. R. Houck. The detection of silicate emission from quasars at 10 and 18 microns . ApJ , 625 pp. L75–L78, June 2005.
- [imanishi_subaru_2011] Masatoshi Imanishi, Keisuke Imase, Nagisa Oi, and Kohei Ichikawa. Subaru and gemini high spatial resolution infrared 18 μm imaging observations of nearby luminous infrared galaxies . AJ , 141 pp. 156, May 2011.
- [lebofsky_extinction_1979] M. J. Lebofsky and G. H. Rieke. Extinction in infrared-emitting galactic nuclei . ApJ , 229 pp. 111–117, April 1979.
- [neugebauer_variability_1999] G. Neugebauer and K. Matthews. Variability of quasars at 10 microns . AJ , 118 pp. 35–45, July 1999.
- [rieke_infrared_1972] G. H. Rieke and F. J. Low. Infrared photometry of extragalactic sources . ApJL , 176 pp. L95, September 1972.
- [rieke_infrared_1978] G. H. Rieke. The infrared emission of seyfert galaxies . ApJ , 226 pp. 550–558, December 1978.
- [roche_8-13_1984] P. F. Roche, B. Whitmore, D. K. Aitken, and M. M. Phillips. 8-13 micron spectrophotometry of galaxies. II - 10 seyferts and 3C 273 . MNRAS , 207 pp. 35–45, March 1984.
- [sanders_continuum_1989] D. B. Sanders, E. S. Phinney, G. Neugebauer, B. T. Soifer, and K. Matthews. Continuum energy distribution of quasars - shapes and origins . ApJ , 347 pp. 29–51, December 1989.
- [schinnerer_molecular_1998] E. Schinnerer, A. Eckart, and L. J. Tacconi. Molecular gas and star formation in the host galaxy of the QSO i ZW 1 . ApJ , 500 pp. 147, June 1998.
- [schweitzer_extended_2008] M. Schweitzer, B. Groves, H. Netzer, D. Lutz, E. Sturm, A. Contursi, R. Genzel, L. J. Tacconi, S. Veilleux, D.-C. Kim, D. Rupke, and A. J. Baker. Extended silicate dust emission in palomar-green QSOs . ApJ , 679 pp. 101–117, May 2008.
- [soifer_high_2004] B. T. Soifer, G. Neugebauer, K. Matthews, E. Egami, and L. Armus. High spatial resolution mid-infrared observations of five seyfert galaxies . PASP , 116 pp. 493–496, June 2004.
- [sosa-brito_integral_2001] Rafael M. Sosa-Brito, Lowell E. Tacconi-Garman, Matthew D. Lehnert, and Jack F. Gallimore. Integral field near-infrared spectroscopy of a sample of seyfert and LINER galaxies. i. the data . ApJS , 136 pp. 61–98, September 2001.
- [veron-cetty_catalogue_2010] M.-P. Véron-Cetty and P. Véron. A catalogue of quasars and active nuclei: 13th edition . A&A , 518 pp. 10, July 2010.
- [weedman_mid-infrared_2005] D. W. Weedman, Lei Hao, S. J. U. Higdon, D. Devost, Yanling Wu, V. Charmandaris, B. Brandl, E. Bass, and J. R. Houck. Mid-infrared spectra of classical AGNs observed with the spitzer space telescope . ApJ , 633 pp. 706–716, November 2005.
Images
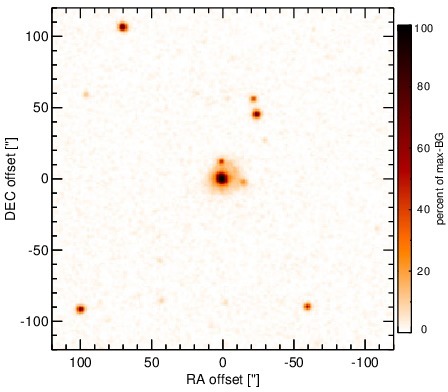
Optical image (DSS, red filter). Displayed are the central 4 arcmin with North being up and East to the left. The colour scaling is linear with white corresponding to the median background (BG) and black to the 0.01% pixels with the highest intensity.
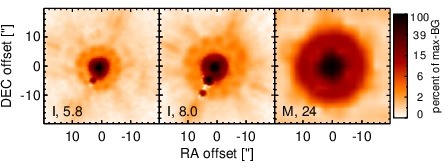
Spitzer MIR images. Displayed are the inner 40 arcsec with North being up and East to the left. The colour scaling is logarithmic with white corresponding to median BG and black to the 0.1% pixels with the highest intensity. The label in the bottom left states instrument and central wavelength of the filter in micron (I: IRAC, M: MIPS).
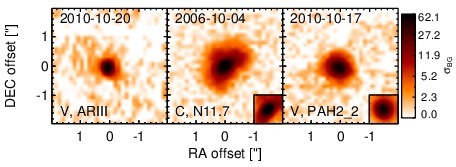
Subarcsecond-resolution MIR images sorted by increasing filter central wavelength. Displayed are the inner 4 arcsec with North being up and East to the left. The colour scaling is logarithmic with white corresponding to median BG and black to the 75% of the highest intensity of all images in units of sig_bg. The inset image (where present; either bottom or top right) shows the central arcsecond of the PSF from the calibrator star, scaled to match the science target. The labels in the bottom left state instrument and filter names (C: COMICS, M: Michelle, T: T-ReCS, V: VISIR).
SEDs
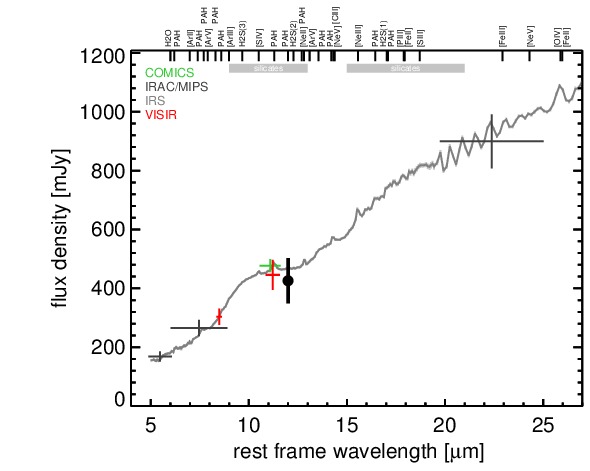
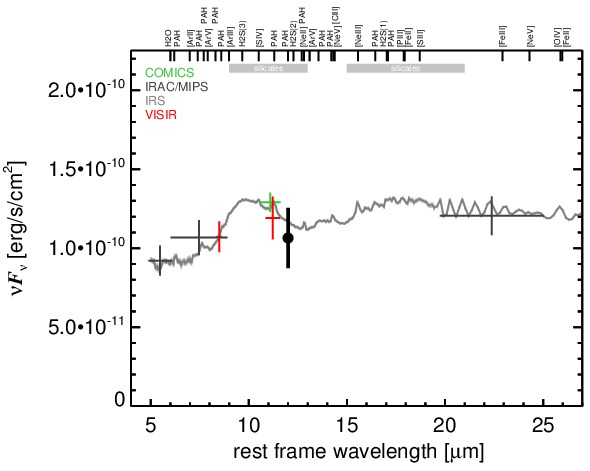
MIR SED. The description of the symbols in all the SED plots (where present) is the following: Grey crosses and solid lines mark the Spitzer/IRAC, MIPS and IRS data. The colour coding of the other symbols is as follows: green for COMICS, magenta for Michelle, blue for T-ReCS and red for VISIR data. Darker-coloured solid lines mark spectra of the corresponding instrument. The black filled circles mark the nuclear 12 and 18 micron continuum emission estimate from the data (where present). The ticks on the top axis mark positions of common MIR emission lines, while the light grey horizontal bars mark wavelength ranges affected by the silicate 10 and 18 micron features.