Sasmirala Individual Information for IC 1459
Description
IC 1459 is a giant elliptical galaxy at a distance of D = 30.3 Mpc (z = 0.006; [blakeslee_synthesis_2001]) with a moderately radio-loud LINER nucleus [veron-cetty_catalogue_2010]. The detection of a compact flat-spectrum radio core verifies the AGN nature of IC 1459 [slee_parsecscale_1994]. Its stellar core is counter-rotating, which indicates a past merger [franx_counterrotating_1988], and hosts one of the most massive black holes of the nearby galaxy population (log MBH∕M⊙ = 9 ± 0.4; [cappellari_counterrotating_2002]). IC 1459 was first observed in the N-band with IRTF in 1983 [sparks_infrared_1986] and thereafter with IRAS, ISO [temi_ages_2005] and Spitzer/IRAC, IRS and MIPS. In the IRAC 5.8 and 8.0 μm and MIPS 24 μm images, an extended nuclear structure was detected with a PA of ~ 0∘. Because we isolate the nuclear component in our photometric measurements, the resulting fluxes are significantly lower than the values published in [temi_spitzer_2009] for MIPS 24 μm. The IRS LR mapping-mode spectrum has a relatively low S/N but indicates silicate 10 μm and PAH 11.3 μm emission and an extremely blue spectral slope at short wavelengths in νFν-space. Thus, no prominent AGN contribution is evident in the MIR spectrum of IC 1459, which instead resembles more the SED of an old stellar population (compare e.g., [panuzzo_nearby_2011]). We observed IC 1459 with VISIR in two narrow N-band filters in 2009 [asmus_mid-infrared_2011] but did not detect any nuclear MIR emission. This is also the case for an additional, to our knowledge, unpublished VISIR observation from the same year. The derived upper limits are significantly below the Spitzer spectrophotometric flux levels in agreement with the latter arising from extended host emission.
- [asmus_mid-infrared_2011] D. Asmus, P. Gandhi, A. Smette, S. F. Hönig, and W. J. Duschl. Mid-infrared properties of nearby low-luminosity AGN at high angular resolution . A&A , 536 pp. 36, December 2011.
- [blakeslee_synthesis_2001] John P. Blakeslee, John R. Lucey, Brian J. Barris, Michael J. Hudson, and John L. Tonry. A synthesis of data from fundamental plane and surface brightness fluctuation surveys . MNRAS , 327 pp. 1004–1020, November 2001.
- [cappellari_counterrotating_2002] M. Cappellari, E. K. Verolme, R. P. van der Marel, G. A. Verdoes Kleijn, G. D. Illingworth, M. Franx, C. M. Carollo, and P. T. de Zeeuw. The counterrotating core and the black hole mass of IC 1459 . ApJ , 578 pp. 787–805, October 2002.
- [franx_counterrotating_1988] Marijn Franx and Garth D. Illingworth. A counterrotating core in IC 1459 . ApJL , 327 pp. L55–L59, April 1988.
- [panuzzo_nearby_2011] P. Panuzzo, R. Rampazzo, A. Bressan, O. Vega, F. Annibali, L. M. Buson, M. S. Clemens, and W. W. Zeilinger. Nearby early-type galaxies with ionized gas. VI. the spitzer-IRS view. basic data set analysis and empirical spectral classification . A&A , 528 pp. 10, April 2011.
- [slee_parsecscale_1994] O. B. Slee, E. M. Sadler, J. E. Reynolds, and R. D. Ekers. Parsecscale radio cores in early type galaxies . MNRAS , 269 pp. 928, August 1994.
- [sparks_infrared_1986] W. B. Sparks, J. H. Hough, D. J. Axon, and J. Bailey. Infrared photometry of the nuclei of early-type radio galaxies . MNRAS , 218 pp. 429–444, February 1986.
- [temi_ages_2005] Pasquale Temi, William G. Mathews, and Fabrizio Brighenti. The ages of elliptical galaxies from mid-infrared emission . ApJ , 622 pp. 235–243, March 2005.
- [temi_spitzer_2009] Pasquale Temi, Fabrizio Brighenti, and William G. Mathews. Spitzer observations of passive and star-forming early-type galaxies: An infrared color-color sequence . ApJ , 707 pp. 890–902, December 2009.
- [veron-cetty_catalogue_2010] M.-P. Véron-Cetty and P. Véron. A catalogue of quasars and active nuclei: 13th edition . A&A , 518 pp. 10, July 2010.
Images
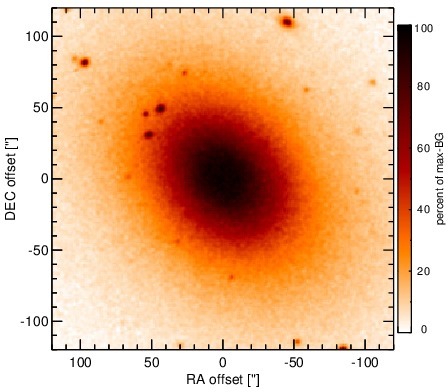
Optical image (DSS, red filter). Displayed are the central 4 arcmin with North being up and East to the left. The colour scaling is linear with white corresponding to the median background (BG) and black to the 0.01% pixels with the highest intensity.
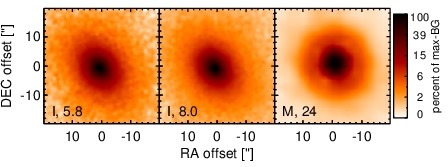
Spitzer MIR images. Displayed are the inner 40 arcsec with North being up and East to the left. The colour scaling is logarithmic with white corresponding to median BG and black to the 0.1% pixels with the highest intensity. The label in the bottom left states instrument and central wavelength of the filter in micron (I: IRAC, M: MIPS).
SEDs
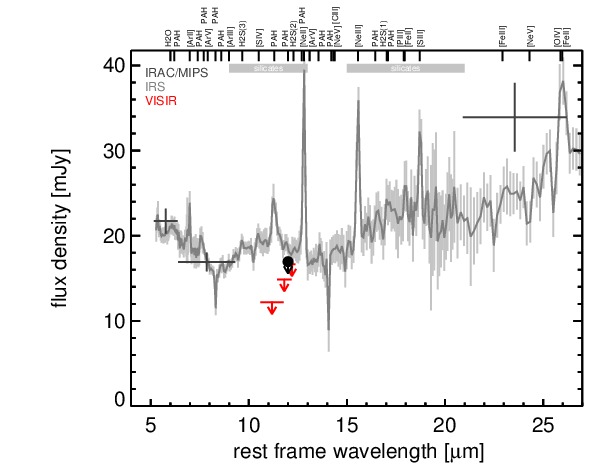
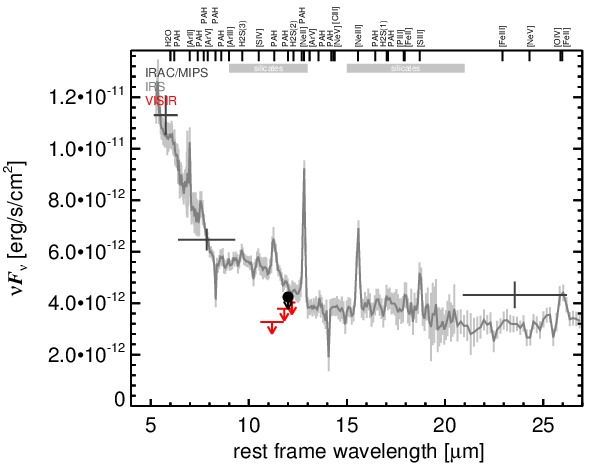
MIR SED. The description of the symbols in all the SED plots (where present) is the following: Grey crosses and solid lines mark the Spitzer/IRAC, MIPS and IRS data. The colour coding of the other symbols is as follows: green for COMICS, magenta for Michelle, blue for T-ReCS and red for VISIR data. Darker-coloured solid lines mark spectra of the corresponding instrument. The black filled circles mark the nuclear 12 and 18 micron continuum emission estimate from the data (where present). The ticks on the top axis mark positions of common MIR emission lines, while the light grey horizontal bars mark wavelength ranges affected by the silicate 10 and 18 micron features.