Sasmirala Individual Information for IC 3639
Description
IC 3639 is a face-on spiral galaxy at a redshift of z = 0.0109 (D ~ 49.5 Mpc) with an AGN and a recent nuclear starburst [gonzalez_delgado_ultraviolet-optical_1998, gonzalez_delgado_nuclear_2001]. The AGN is optically classified as a Sy 2 [kewley_optical_2001] with polarized broad lines being detected [heisler_visibility_1997]. According to [yuan_role_2010], the AGN is dominating the emission, and we do not treat IC 3639 as AGN/starburst composite. It was observed with Spitzer/IRAC, IRS and MIPS and shows a clear spiral-like emission structure in the IRAC 5.8 and 8.0 μm and MIPS 24 μm images with decreasing prominence, which is dominated by a central marginally resolved source. While our IRAC 5.8 μm flux matches the value of [gallimore_infrared_2010], our IRAC 8.0 μm flux is significantly lower but matches the flux levels of the IRS LR mapping-mode spectrum. The latter displays a MIR SED with silicate 10 μm absorption and PAH emission, indicating a star-formation contribution. The spectral slope is rather red and peaks at ~ 25 μm in νFν-space (see also [buchanan_spitzer_2006, tommasin_spitzer_2008, deo_mid-infrared_2009, wu_spitzer/irs_2009]). IC 3639 was observed with T-ReCS in a broad N-band filter in 2004 [videla_nuclear_2013] and with VISIR in three narrow N-band filters in 2008 [gandhi_resolving_2009]. A compact MIR nucleus without any detection of extended host emission is visible in all images. The nucleus is possibly marginally resolved in the NEII_2 filter image (FWHM ~ 0.39arcsec ~ 91 pc) but not in the others. In particular in the PAH2 filter image, the nucleus is unresolved with a FWHM< 0.34arcsec. Thus, we classify IC 3639 as unresolved in the MIR at subarcsecond resolution in general. We obtain a flux that is ten times higher than [videla_nuclear_2013] for the T-ReCS–detected nucleus, which is presumably caused by a typo in that paper. Our reanalysis of the PAH2 and NEII_2 images yields flux values consistent with [gandhi_resolving_2009]. Our subarcsecond photometry agrees also with the Spitzer spectrophotometry, indicating that at least part of the star formation must occur in the projected central ~ 80 pc as already pointed out by [gonzalez_delgado_ultraviolet-optical_1998]. Interestingly, the nucleus of IC 3639 was not detected during MIR interferometric observations with MIDI on a short baseline. This indicates that the nuclear MIR emission is dominated by very extended structures at milliarcsecond scales [burtscher_diversity_2013].
- [buchanan_spitzer_2006] Catherine L. Buchanan, Jack F. Gallimore, Christopher P. O'Dea, Stefi A. Baum, David J. Axon, Andrew Robinson, Moshe Elitzur, and Martin Elvis. Spitzer IRS spectra of a large sample of seyfert galaxies: A variety of infrared spectral energy distributions in the local active galactic nucleus population . AJ , 132 pp. 401–419, July 2006.
- [burtscher_diversity_2013] L. Burtscher, K. Meisenheimer, K. R. W. Tristram, W. Jaffe, S. F. Hönig, R. I. Davies, M. Kishimoto, J.-U. Pott, H. Röttgering, M. Schartmann, G. Weigelt, and S. Wolf. A diversity of dusty AGN tori. data release for the VLTI/MIDI AGN large program and first results for 23 galaxies . A&A , 558 pp. 149, October 2013.
- [deo_mid-infrared_2009] Rajesh P. Deo, Gordon T. Richards, D. M. Crenshaw, and S. B. Kraemer. The mid-infrared continua of seyfert galaxies . ApJ , 705 pp. 14–31, November 2009.
- [gallimore_infrared_2010] J. F. Gallimore, A. Yzaguirre, J. Jakoboski, M. J. Stevenosky, D. J. Axon, S. A. Baum, C. L. Buchanan, M. Elitzur, M. Elvis, C. P. O'Dea, and A. Robinson. Infrared spectral energy distributions of seyfert galaxies: Spitzer space telescope observations of the 12 μm sample of active galaxies . ApJS , 187 pp. 172–211, March 2010.
- [gandhi_resolving_2009] P. Gandhi, H. Horst, A. Smette, S. Hönig, A. Comastri, R. Gilli, C. Vignali, and W. Duschl. Resolving the mid-infrared cores of local seyferts . A&A , 502 pp. 457–472, August 2009.
- [gonzalez_delgado_nuclear_2001] Rosa M. González Delgado, Timothy Heckman, and Claus Leitherer. The nuclear and circumnuclear stellar population in seyfert 2 galaxies: Implications for the starburst-active galactic nucleus connection . ApJ , 546 pp. 845–865, January 2001.
- [gonzalez_delgado_ultraviolet-optical_1998] Rosa M. González Delgado, Timothy Heckman, Claus Leitherer, Gerhardt Meurer, Julian Krolik, Andrew S. Wilson, Anne Kinney, and Anuradha Koratkar. Ultraviolet-optical observations of the seyfert 2 galaxies NGC 7130, NGC 5135, and IC 3639: Implications for the starburst-active galactic nucleus connection . ApJ , 505 pp. 174–198, September 1998.
- [heisler_visibility_1997] Charlene A. Heisler, Stuart L. Lumsden, and Jeremy A. Bailey. Visibility of scattered broad-line emission in seyfert 2 galaxies . Nature , 385 pp. 700–702, February 1997.
- [kewley_optical_2001] L. J. Kewley, C. A. Heisler, M. A. Dopita, and S. Lumsden. Optical classification of southern warm infrared galaxies . ApJS , 132 pp. 37–71, January 2001.
- [tommasin_spitzer_2008] Silvia Tommasin, Luigi Spinoglio, Matthew A. Malkan, Howard Smith, Eduardo González-Alfonso, and Vassilis Charmandaris. Spitzer IRS high-resolution spectroscopy of the 12 μm seyfert galaxies. i. first results . ApJ , 676 pp. 836–856, April 2008.
- [videla_nuclear_2013] Liza Videla, Paulina Lira, Heather Andrews, Almudena Alonso-Herrero, David M. Alexander, and Martin Ward. Nuclear infrared spectral energy distribution of type II active galactic nuclei . ApJS , 204 pp. 23, February 2013.
- [wu_spitzer/irs_2009] Yanling Wu, Vassilis Charmandaris, Jiasheng Huang, Luigi Spinoglio, and Silvia Tommasin. Spitzer/IRS 5-35 μm low-resolution spectroscopy of the 12 μm seyfert sample . ApJ , 701 pp. 658–676, August 2009.
- [yuan_role_2010] T.-T. Yuan, L. J. Kewley, and D. B. Sanders. The role of starburst-active galactic nucleus composites in luminous infrared galaxy mergers: Insights from the new optical classification scheme . ApJ , 709 pp. 884–911, February 2010.
Images
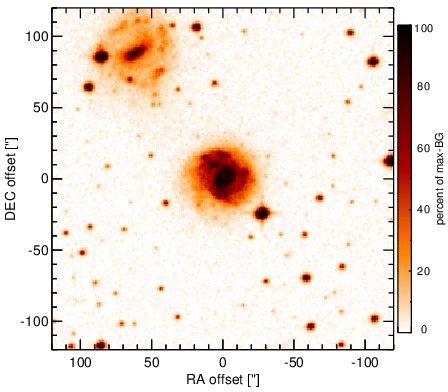
Optical image (DSS, red filter). Displayed are the central 4 arcmin with North being up and East to the left. The colour scaling is linear with white corresponding to the median background (BG) and black to the 0.01% pixels with the highest intensity.
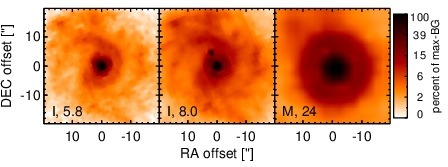
Spitzer MIR images. Displayed are the inner 40 arcsec with North being up and East to the left. The colour scaling is logarithmic with white corresponding to median BG and black to the 0.1% pixels with the highest intensity. The label in the bottom left states instrument and central wavelength of the filter in micron (I: IRAC, M: MIPS).
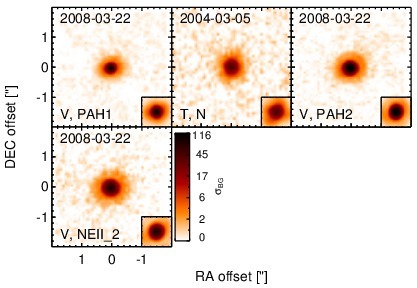
Subarcsecond-resolution MIR images sorted by increasing filter central wavelength. Displayed are the inner 4 arcsec with North being up and East to the left. The colour scaling is logarithmic with white corresponding to median BG and black to the 75% of the highest intensity of all images in units of sig_bg. The inset image (where present; either bottom or top right) shows the central arcsecond of the PSF from the calibrator star, scaled to match the science target. The labels in the bottom left state instrument and filter names (C: COMICS, M: Michelle, T: T-ReCS, V: VISIR).
SEDs
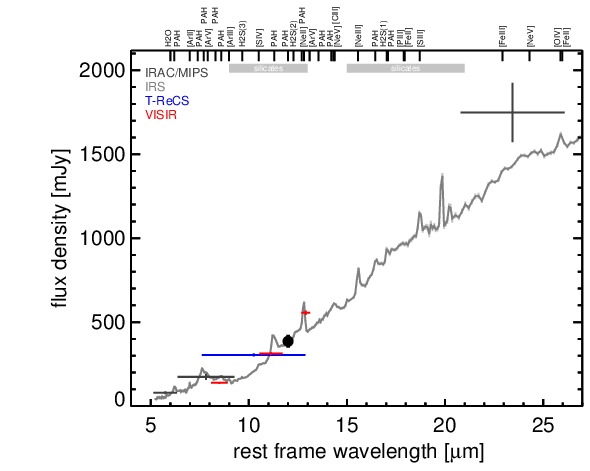
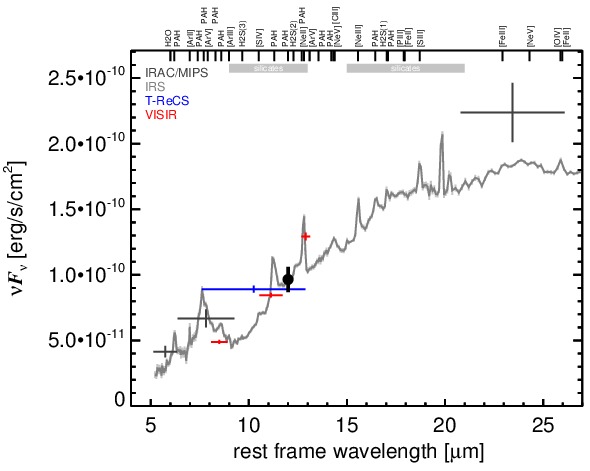
MIR SED. The description of the symbols in all the SED plots (where present) is the following: Grey crosses and solid lines mark the Spitzer/IRAC, MIPS and IRS data. The colour coding of the other symbols is as follows: green for COMICS, magenta for Michelle, blue for T-ReCS and red for VISIR data. Darker-coloured solid lines mark spectra of the corresponding instrument. The black filled circles mark the nuclear 12 and 18 micron continuum emission estimate from the data (where present). The ticks on the top axis mark positions of common MIR emission lines, while the light grey horizontal bars mark wavelength ranges affected by the silicate 10 and 18 micron features.