Sasmirala Individual Information for IC 4518W
Description
IC 4518W is the western galaxy of an interacting pair with a nuclear separation of ~ 38arcsec at a redshift of z = 0.0163 (D ~ 70.2 Mpc) hosting a Sy 2 nucleus [veron-cetty_catalogue_2010]. It was observed with Spitzer/IRAC, IRS and MIPS, where a compact MIR nucleus without any host emission was detected. Note that IC 4518E is also detected and extended in the IRAC and MIPS images. The IRS LR staring-mode PBCD spectrum matches well the IRAC 5.8 and 8.0 μm and MIPS 24 μm photometry and shows deep silicate 10 μm absorption (possibly also at 18 μm) and PAH emission with a steep red slope in νFν-space. The Spitzer data thus contain significant star-formation contribution. IC 4518W was observed with T-ReCS in the N filter in 2006 where a compact MIR nucleus possibly embedded in weak extended emission was detected [alonso-herrero_high_2006]. Our reanalysis of the image yields a nuclear flux consistent with the value of [alonso-herrero_high_2006]. In addition, a LR T-ReCS spectrum was taken of IC 4518W in 2006 [diaz-santos_high_2010], which shows a lower continuum flux level than the IRS spectrum without any PAH features but at least the same silicate 10 μm depth. Therefore, the star formation contribution at subarcsecond resolution is probably minor in the nucleus of IC 4518W (see also [alonso-herrero_local_2012]). We use the T-ReCS spectrum to compute the nuclear 12 μm continuum emission estimate corrected for the silicate absorption.
- [alonso-herrero_high_2006] Almudena Alonso-Herrero, Luis Colina, Christopher Packham, Tanio Díaz-Santos, George H. Rieke, James T. Radomski, and Charles M. Telesco. High spatial resolution t-ReCS mid-infrared imaging of luminous infrared galaxies . ApJ , 652 pp. L83–L87, December 2006.
- [alonso-herrero_local_2012] Almudena Alonso-Herrero, Miguel Pereira-Santaella, George H. Rieke, and Dimitra Rigopoulou. Local luminous infrared galaxies. II. active galactic nucleus activity from Spitzer/Infrared spectrograph spectra . ApJ , 744 pp. 2, January 2012.
- [diaz-santos_high_2010] Tanio Díaz-Santos, Almudena Alonso-Herrero, Luis Colina, Christopher Packham, N. A. Levenson, Miguel Pereira-Santaella, Patrick F. Roche, and Charles M. Telesco. A high spatial resolution mid-infrared spectroscopic study of the nuclei and star-forming regions in luminous infrared galaxies . ApJ , 711 pp. 328–349, March 2010.
- [veron-cetty_catalogue_2010] M.-P. Véron-Cetty and P. Véron. A catalogue of quasars and active nuclei: 13th edition . A&A , 518 pp. 10, July 2010.
Images
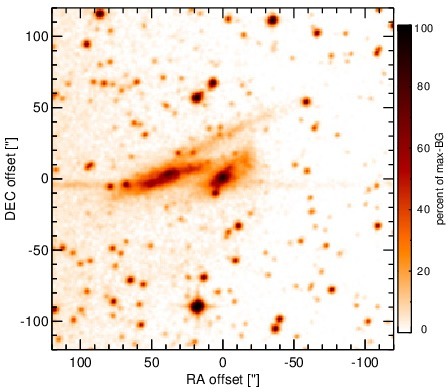
Optical image (DSS, red filter). Displayed are the central 4 arcmin with North being up and East to the left. The colour scaling is linear with white corresponding to the median background (BG) and black to the 0.01% pixels with the highest intensity.
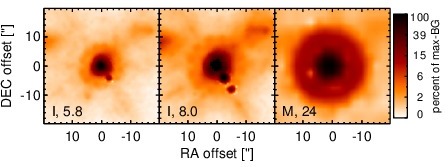
Spitzer MIR images. Displayed are the inner 40 arcsec with North being up and East to the left. The colour scaling is logarithmic with white corresponding to median BG and black to the 0.1% pixels with the highest intensity. The label in the bottom left states instrument and central wavelength of the filter in micron (I: IRAC, M: MIPS).
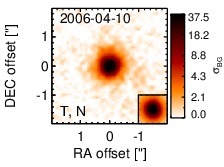
Subarcsecond-resolution MIR images sorted by increasing filter central wavelength. Displayed are the inner 4 arcsec with North being up and East to the left. The colour scaling is logarithmic with white corresponding to median BG and black to the 75% of the highest intensity of all images in units of sig_bg. The inset image (where present; either bottom or top right) shows the central arcsecond of the PSF from the calibrator star, scaled to match the science target. The labels in the bottom left state instrument and filter names (C: COMICS, M: Michelle, T: T-ReCS, V: VISIR).
SEDs
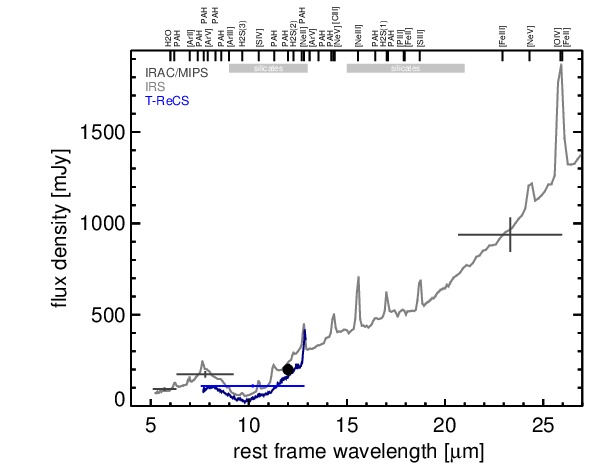
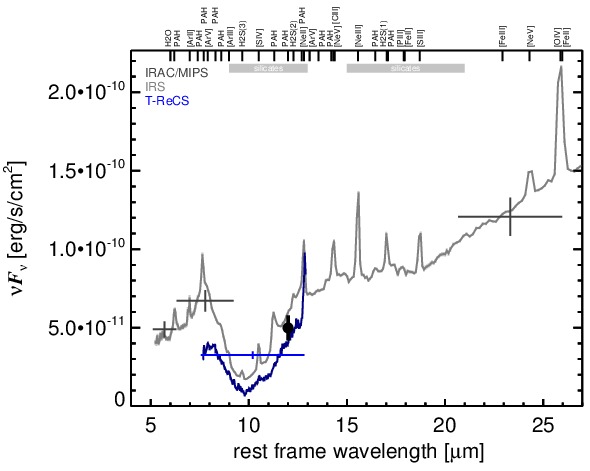
MIR SED. The description of the symbols in all the SED plots (where present) is the following: Grey crosses and solid lines mark the Spitzer/IRAC, MIPS and IRS data. The colour coding of the other symbols is as follows: green for COMICS, magenta for Michelle, blue for T-ReCS and red for VISIR data. Darker-coloured solid lines mark spectra of the corresponding instrument. The black filled circles mark the nuclear 12 and 18 micron continuum emission estimate from the data (where present). The ticks on the top axis mark positions of common MIR emission lines, while the light grey horizontal bars mark wavelength ranges affected by the silicate 10 and 18 micron features.