Sasmirala Individual Information for IC 5063
Description
IC 5063 is a peculiar galaxy with both spiral and elliptical properties at a redshift of z = 0.0113 (D ~ 45.3 Mpc) with a Sy 2 nucleus [kewley_optical_2001] with polarized broad lines being detected [lumsden_spectropolarimetry_2004]. It belongs to the nine-month BAT AGN sample, is luminous at radio wavelengths and possesses an extended NLR (PA~-65∘; [morganti_radio_1998, morganti_radio_1999, schmitt_hubble_2003]). [colina_ic_1991] propose IC 5063 to be the remnant of a recent merger, while [martini_circumnuclear_2003] speculate that the nuclear obscuration might be caused by foreground dust lanes. After IRAS, N-band observations of IC 5063 were performed with the ESO 3.6 m/TIMMI2 in 2002, where an unresolved MIR nucleus was detected [siebenmorgen_mid-infrared_2004]. It was also observed with Spitzer/IRAC, IRS and MIPS, where the MIR nucleus is nearly unresolved, and no further host emission was detected. Note that the IRAC 8.0 μm PBCD image is partly saturated and thus is not used (but see [gallimore_infrared_2010]). Our nuclear photometry of the IRAC 5.8 μm data agrees with [gallimore_infrared_2010], while our MIPS 24 μm flux is significantly higher than the value in [temi_spitzer_2009] but agrees with the IRAC and IRS data. The IRS LR staring-mode spectrum displays silicate 10 μm absorption and weak PAH emission. The spectral slope is red but flattening towards longer wavelengths in νFν-space (see also [wu_spitzer/irs_2009, tommasin_spitzer-irs_2010, gallimore_infrared_2010, mullaney_defining_2011]). IC 5063 was observed with T-ReCS in imaging mode in three N- and Q-band filters in 2004 and 2005 [videla_nuclear_2013, ramos_almeida_infrared_2009], and in LR spectroscopy mode in the N-band in 2005 [young_spatially_2007, gonzalez-martin_dust_2013]. We imaged IC 5063 with VISIR in four narrow N-band filters in 2005 and 2006, and also took a LR N-band spectrum in 2006 [horst_small_2006, horst_mid_2008, honig_dusty_2010-1]. In all T-ReCS and VISIR images, a compact but consistently elongated MIR nucleus (FWHM(major axis)~ 0.52arcsec ~ 110 pc; PA~ 107∘) without any host further emission was detected. The direction of this elongation coincides with the extended [O III] emission ([schmitt_hubble_2003]; see also [honig_dusty_2010-1]). Our Gaussian flux values of the subarcsecond photometry are consistent with [horst_small_2006, horst_mid_2008] and [videla_nuclear_2013], while for the Si2 filter our PSF flux agrees with the one from [ramos_almeida_infrared_2009], only our Qa flux is significantly lower. The VISIR spectrum from [honig_dusty_2010-1] extracted over 0.75arcsec agrees with the Spitzer spectrophotometry well, while the nuclear subarcsecond PSF photometry is on average ~ 25% lower. However, the T-ReCS spectrum from [gonzalez-martin_dust_2013] has flux levels even lower than our photometry for unknown reasons. Taking into account all the subarcsecond MIR data of IC 5063, the nuclear brightness might have varied up to ~ 25% in the N-band from 2005 to 2006.
- [colina_ic_1991] L. Colina, W. B. Sparks, and F. Macchetto. IC 5063 - a merger remnant with a hidden luminous active nucleus . ApJ , 370 pp. 102–117, March 1991.
- [gallimore_infrared_2010] J. F. Gallimore, A. Yzaguirre, J. Jakoboski, M. J. Stevenosky, D. J. Axon, S. A. Baum, C. L. Buchanan, M. Elitzur, M. Elvis, C. P. O'Dea, and A. Robinson. Infrared spectral energy distributions of seyfert galaxies: Spitzer space telescope observations of the 12 μm sample of active galaxies . ApJS , 187 pp. 172–211, March 2010.
- [gonzalez-martin_dust_2013] O. González-Martín, J. M. Rodríguez-Espinosa, T. Díaz-Santos, C. Packham, A. Alonso-Herrero, P. Esquej, C. Ramos Almeida, R. Mason, and C. Telesco. Dust in active galactic nuclei. mid-infrared t-ReCS/Gemini spectra using the new RedCan pipeline . A&A , 553 pp. 35, May 2013.
- [honig_dusty_2010-1] S. F. Hönig, M. Kishimoto, P. Gandhi, A. Smette, D. Asmus, W. Duschl, M. Polletta, and G. Weigelt. The dusty heart of nearby active galaxies. i. high-spatial resolution mid-IR spectro-photometry of seyfert galaxies . A&A , 515 pp. 23, June 2010.
- [horst_mid_2008] H. Horst, P. Gandhi, A. Smette, and W. J. Duschl. The mid IR - hard x-ray correlation in AGN and its implications for dusty torus models . A&A , 479 pp. 389–396, February 2008.
- [horst_small_2006] H. Horst, A. Smette, P. Gandhi, and W. J. Duschl. The small dispersion of the mid IR - hard x-ray correlation in active galactic nuclei . A&A , 457 pp. L17–L20, October 2006.
- [kewley_optical_2001] L. J. Kewley, C. A. Heisler, M. A. Dopita, and S. Lumsden. Optical classification of southern warm infrared galaxies . ApJS , 132 pp. 37–71, January 2001.
- [lumsden_spectropolarimetry_2004] S. L. Lumsden, D. M. Alexander, and J. H. Hough. Spectropolarimetry of compton-thin seyfert 2 galaxies . MNRAS , 348 pp. 1451–1458, March 2004.
- [martini_circumnuclear_2003] Paul Martini, Michael W. Regan, John S. Mulchaey, and Richard W. Pogge. Circumnuclear dust in nearby active and inactive galaxies. i. data . ApJS , 146 pp. 353–406, June 2003.
- [morganti_radio_1998] R. Morganti, T. Oosterloo, and Z. Tsvetanov. A radio study of the seyfert galaxy IC 5063: Evidence for fast gas outflow . AJ , 115 pp. 915–927, March 1998.
- [morganti_radio_1999] R. Morganti, Z. I. Tsvetanov, J. Gallimore, and M. G. Allen. Radio continuum morphology of southern seyfert galaxies . A&AS , 137 pp. 457–471, June 1999.
- [mullaney_defining_2011] J. R. Mullaney, D. M. Alexander, A. D. Goulding, and R. C. Hickox. Defining the intrinsic AGN infrared spectral energy distribution and measuring its contribution to the infrared output of composite galaxies . MNRAS , page 474, April 2011.
- [ramos_almeida_infrared_2009] C. Ramos Almeida, N. A. Levenson, J. M. Rodríguez Espinosa, A. Alonso-Herrero, A. Asensio Ramos, J. T. Radomski, C. Packham, R. S. Fisher, and C. M. Telesco. The infrared nuclear emission of seyfert galaxies on parsec scales: Testing the clumpy torus models . ApJ , 702 pp. 1127–1149, September 2009.
- [schmitt_hubble_2003] H. R. Schmitt, J. L. Donley, R. R. J. Antonucci, J. B. Hutchings, and A. L. Kinney. A hubble space telescope survey of extended [o III] λ5007 emission in a far-infrared selected sample of seyfert galaxies: Observations . ApJS , 148 pp. 327–352, October 2003.
- [siebenmorgen_mid-infrared_2004] R. Siebenmorgen, E. Krügel, and H. W. W. Spoon. Mid-infrared emission of galactic nuclei. TIMMI2 versus ISO observations and models . A&A , 414 pp. 123–139, January 2004.
- [temi_spitzer_2009] Pasquale Temi, Fabrizio Brighenti, and William G. Mathews. Spitzer observations of passive and star-forming early-type galaxies: An infrared color-color sequence . ApJ , 707 pp. 890–902, December 2009.
- [tommasin_spitzer-irs_2010] Silvia Tommasin, Luigi Spinoglio, Matthew A. Malkan, and Giovanni Fazio. Spitzer-IRS high-resolution spectroscopy of the 12 μm seyfert galaxies. II. results for the complete data set . ApJ , 709 pp. 1257–1283, February 2010.
- [videla_nuclear_2013] Liza Videla, Paulina Lira, Heather Andrews, Almudena Alonso-Herrero, David M. Alexander, and Martin Ward. Nuclear infrared spectral energy distribution of type II active galactic nuclei . ApJS , 204 pp. 23, February 2013.
- [wu_spitzer/irs_2009] Yanling Wu, Vassilis Charmandaris, Jiasheng Huang, Luigi Spinoglio, and Silvia Tommasin. Spitzer/IRS 5-35 μm low-resolution spectroscopy of the 12 μm seyfert sample . ApJ , 701 pp. 658–676, August 2009.
- [young_spatially_2007] S. Young, C. Packham, R. E. Mason, J. T. Radomski, and C. M. Telesco. Spatially resolved mid-infrared spectroscopy of IC5063 . MNRAS , 378 pp. 888–892, July 2007.
Images
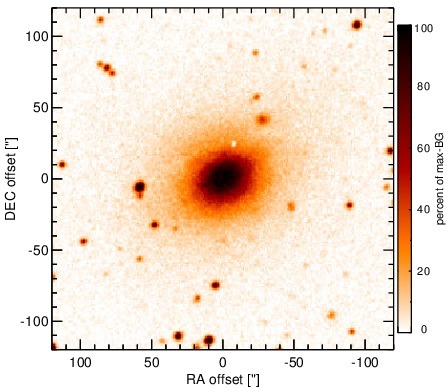
Optical image (DSS, red filter). Displayed are the central 4 arcmin with North being up and East to the left. The colour scaling is linear with white corresponding to the median background (BG) and black to the 0.01% pixels with the highest intensity.
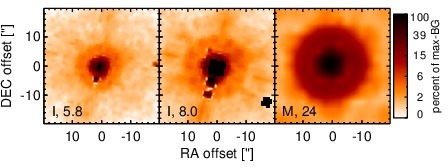
Spitzer MIR images. Displayed are the inner 40 arcsec with North being up and East to the left. The colour scaling is logarithmic with white corresponding to median BG and black to the 0.1% pixels with the highest intensity. The label in the bottom left states instrument and central wavelength of the filter in micron (I: IRAC, M: MIPS).

Subarcsecond-resolution MIR images sorted by increasing filter central wavelength. Displayed are the inner 4 arcsec with North being up and East to the left. The colour scaling is logarithmic with white corresponding to median BG and black to the 75% of the highest intensity of all images in units of sig_bg. The inset image (where present; either bottom or top right) shows the central arcsecond of the PSF from the calibrator star, scaled to match the science target. The labels in the bottom left state instrument and filter names (C: COMICS, M: Michelle, T: T-ReCS, V: VISIR).
SEDs
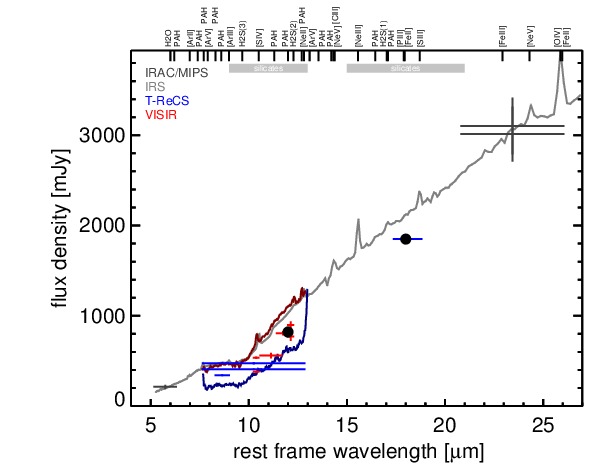
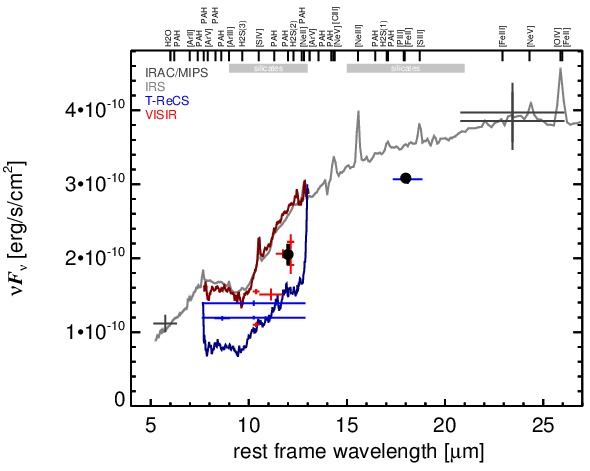
MIR SED. The description of the symbols in all the SED plots (where present) is the following: Grey crosses and solid lines mark the Spitzer/IRAC, MIPS and IRS data. The colour coding of the other symbols is as follows: green for COMICS, magenta for Michelle, blue for T-ReCS and red for VISIR data. Darker-coloured solid lines mark spectra of the corresponding instrument. The black filled circles mark the nuclear 12 and 18 micron continuum emission estimate from the data (where present). The ticks on the top axis mark positions of common MIR emission lines, while the light grey horizontal bars mark wavelength ranges affected by the silicate 10 and 18 micron features.