Sasmirala Individual Information for IC 883
Description
IC 883 is an infrared-luminous galaxy with a peculiar morphology at a redshift of z = 0.0233 (D ~ 101 Mpc), which has an active nucleus optically classified either as LINER [kim_optical_1995, veilleux_optical_1995] or as AGN/starburst composite [yuan_role_2010]. We treat this object as AGN/starburst composite, and because there is no strong evidence for an AGN from other wavelengths, we treat it as an uncertain AGN (but see below). IC 883 was already studied at high angular resolution with Keck/LWS [soifer_high-resolution_2001] in four N-band filters. An elongated, complex MIR structure was detected (FWHM 1.8arcsec × 0.7arcsec, PA 135∘). Only one of the two nuclei (with ~ 1arcsec) separation is visible in the N-band. IC 883 was also observed with Spitzer/IRAC, IRS and MIPS. The same MIR morphology is indicated in the IRAC 5.8 and 8 μm images, while the object appears rather compact in MIPS 24 μm as expected from the lower spatial resolution. The 4arcsec aperture fluxes from [soifer_high-resolution_2001] match our Spitzer spectrophotometry. The IRS LR staring-mode spectrum resembles a typical star-formation SED with strong PAH emission, silicate absorption and a steep rise in flux for wavelengths > 20 μm (see also [vega_modelling_2008]). [imanishi_subaru_2011] observed IC 883 with COMICS Q17.7 and detected an extended nucleus. Because of the low S/N of this detection in our reanalysis of the COMICS data (2.3), we provide only an upper limit for the nuclear MIR emission. The absence of a clear MIR nucleus and the star-formation-like MIR SED cast doubt on the AGN nature of IC 883, although [Ne V] (see also [dudik_spitzer_2009]) and a compact radio source [romero-canizales_e-merlin_2012] are detected.
- [dudik_spitzer_2009] R. P. Dudik, S. Satyapal, and D. Marcu. A spitzer spectroscopic survey of low-ionization nuclear emission-line regions: Characterization of the central source . ApJ , 691 pp. 1501–1524, February 2009.
- [imanishi_subaru_2011] Masatoshi Imanishi, Keisuke Imase, Nagisa Oi, and Kohei Ichikawa. Subaru and gemini high spatial resolution infrared 18 μm imaging observations of nearby luminous infrared galaxies . AJ , 141 pp. 156, May 2011.
- [kim_optical_1995] D.-C. Kim, D. B. Sanders, S. Veilleux, J. M. Mazzarella, and B. T. Soifer. Optical spectroscopy of luminous infrared galaxies. i. nuclear data . ApJS , 98 pp. 129, May 1995.
- [romero-canizales_e-merlin_2012] C. Romero-Cañizales, M. A. Pérez-Torres, A. Alberdi, M. K. Argo, R. J. Beswick, E. Kankare, F. Batejat, A. Efstathiou, S. Mattila, J. E. Conway, S. T. Garrington, T. W. B. Muxlow, S. D. Ryder, and P. Väisänen. e-MERLIN and VLBI observations of the luminous infrared galaxy IC 883: a nuclear starburst and an AGN candidate revealed . A&A , 543 pp. 72, July 2012.
- [soifer_high-resolution_2001] B. T. Soifer, G. Neugebauer, K. Matthews, E. Egami, A. J. Weinberger, M. Ressler, N. Z. Scoville, S. R. Stolovy, J. J. Condon, and E. E. Becklin. High-resolution mid-infrared imaging of infrared-luminous starburst galaxies . AJ , 122 pp. 1213–1237, September 2001.
- [vega_modelling_2008] O. Vega, M. S. Clemens, A. Bressan, G. L. Granato, L. Silva, and P. Panuzzo. Modelling the spectral energy distribution of ULIRGs. II. the energetic environment and the dense interstellar medium . A&A , 484 pp. 631–653, June 2008.
- [veilleux_optical_1995] S. Veilleux, D.-C. Kim, D. B. Sanders, J. M. Mazzarella, and B. T. Soifer. Optical spectroscopy of luminous infrared galaxies. II. analysis of the nuclear and long-slit data . ApJS , 98 pp. 171, May 1995.
- [yuan_role_2010] T.-T. Yuan, L. J. Kewley, and D. B. Sanders. The role of starburst-active galactic nucleus composites in luminous infrared galaxy mergers: Insights from the new optical classification scheme . ApJ , 709 pp. 884–911, February 2010.
Images
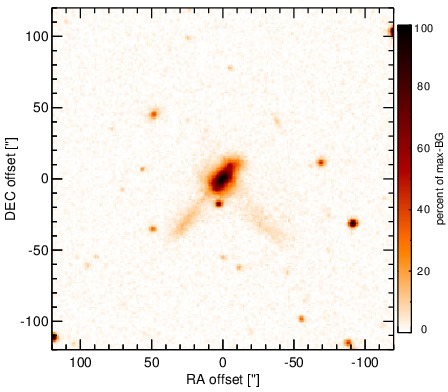
Optical image (DSS, red filter). Displayed are the central 4 arcmin with North being up and East to the left. The colour scaling is linear with white corresponding to the median background (BG) and black to the 0.01% pixels with the highest intensity.
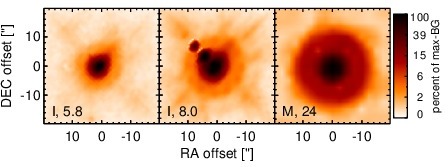
Spitzer MIR images. Displayed are the inner 40 arcsec with North being up and East to the left. The colour scaling is logarithmic with white corresponding to median BG and black to the 0.1% pixels with the highest intensity. The label in the bottom left states instrument and central wavelength of the filter in micron (I: IRAC, M: MIPS).
SEDs
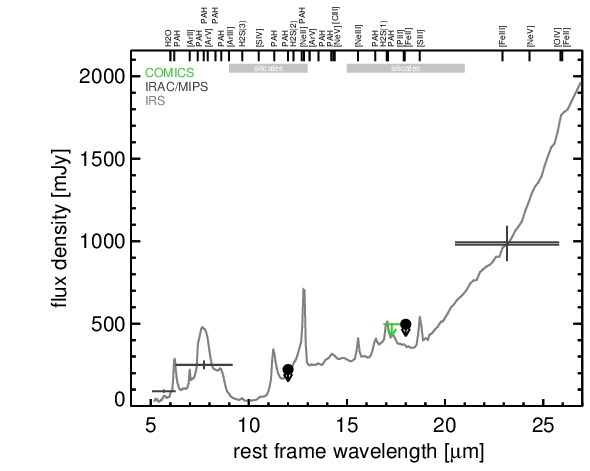
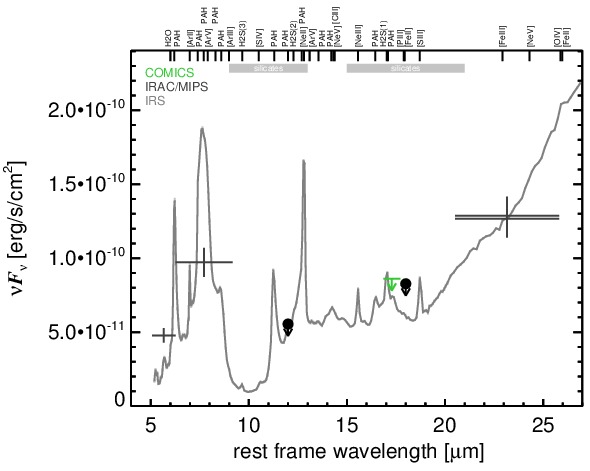
MIR SED. The description of the symbols in all the SED plots (where present) is the following: Grey crosses and solid lines mark the Spitzer/IRAC, MIPS and IRS data. The colour coding of the other symbols is as follows: green for COMICS, magenta for Michelle, blue for T-ReCS and red for VISIR data. Darker-coloured solid lines mark spectra of the corresponding instrument. The black filled circles mark the nuclear 12 and 18 micron continuum emission estimate from the data (where present). The ticks on the top axis mark positions of common MIR emission lines, while the light grey horizontal bars mark wavelength ranges affected by the silicate 10 and 18 micron features.