Sasmirala Individual Information for IRAS 01003-2238
Description
IRAS 01003-2238 is classified as an ultra-luminous infrared galaxy and a Wolf-Rayet galaxy indicating a recent starburst [armus_detection_1988]. It has a redshift of z = 0.1178 (D ~ 523 Mpc) and hosts a Sy 2 nucleus, which appears to dominate over the starburst [yuan_role_2010] . IRAS 01003-2238 was observed with Spitzer/IRAC and IRS and appears nearly unresolved in the IRAC 5.8 μm image. The IRS LR staring-mode spectrum shows deep silicate 10 and 18 μm absorption and only weak PAH emission (see also [imanishi_spitzer_2007, farrah_high-resolution_2007]). The spectral slope is red in νFν-space. IRAS 0103-2238 was observed with T-ReCS in the Qa filter in 2008 and a compact MIR nucleus was detected [imanishi_subaru_2011]. Our measured nuclear Qa flux is consistent with the value from [imanishi_subaru_2011] but is interestingly 10% higher than the Spitzer spectrophotometry, i.e., basically at the level of the continuum without the silicate 18 μm absorption. This indicates that this absorption is possibly not caused in the inner kiloparsec of IRAS 01003-2238. For the 12 μm continuum emission estimate, we use the IRS spectrum to correct for the silicate 10 μm feature.
- [armus_detection_1988] L. Armus, T. M. Heckman, and G. K. Miley. The detection of wolf-rayet stars in a very powerful far-infrared galaxy - direct evidence for a starburst . ApJL , 326 pp. L45–L49, March 1988.
- [farrah_high-resolution_2007] D. Farrah, J. Bernard-Salas, H. W. W. Spoon, B. T. Soifer, L. Armus, B. Brandl, V. Charmandaris, V. Desai, S. Higdon, D. Devost, and J. Houck. High-resolution mid-infrared spectroscopy of ultraluminous infrared galaxies . ApJ , 667 pp. 149–169, September 2007.
- [imanishi_spitzer_2007] Masatoshi Imanishi, C. C. Dudley, Roberto Maiolino, Philip R. Maloney, Takao Nakagawa, and Guido Risaliti. A spitzer IRS low-resolution spectroscopic search for buried AGNs in nearby ultraluminous infrared galaxies: A constraint on geometry between energy sources and dust . ApJS , 171 pp. 72–100, July 2007.
- [imanishi_subaru_2011] Masatoshi Imanishi, Keisuke Imase, Nagisa Oi, and Kohei Ichikawa. Subaru and gemini high spatial resolution infrared 18 μm imaging observations of nearby luminous infrared galaxies . AJ , 141 pp. 156, May 2011.
- [yuan_role_2010] T.-T. Yuan, L. J. Kewley, and D. B. Sanders. The role of starburst-active galactic nucleus composites in luminous infrared galaxy mergers: Insights from the new optical classification scheme . ApJ , 709 pp. 884–911, February 2010.
Images
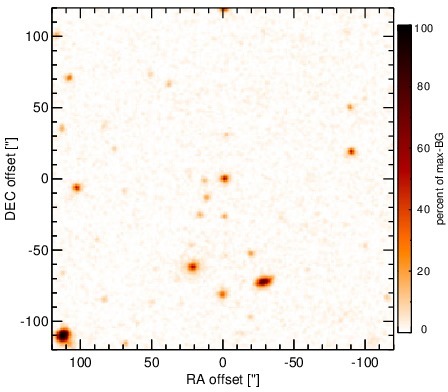
Optical image (DSS, red filter). Displayed are the central 4 arcmin with North being up and East to the left. The colour scaling is linear with white corresponding to the median background (BG) and black to the 0.01% pixels with the highest intensity.
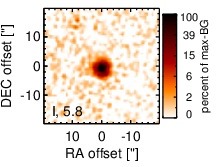
Spitzer MIR images. Displayed are the inner 40 arcsec with North being up and East to the left. The colour scaling is logarithmic with white corresponding to median BG and black to the 0.1% pixels with the highest intensity. The label in the bottom left states instrument and central wavelength of the filter in micron (I: IRAC, M: MIPS).
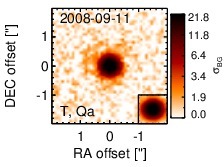
Subarcsecond-resolution MIR images sorted by increasing filter central wavelength. Displayed are the inner 4 arcsec with North being up and East to the left. The colour scaling is logarithmic with white corresponding to median BG and black to the 75% of the highest intensity of all images in units of sig_bg. The inset image (where present; either bottom or top right) shows the central arcsecond of the PSF from the calibrator star, scaled to match the science target. The labels in the bottom left state instrument and filter names (C: COMICS, M: Michelle, T: T-ReCS, V: VISIR).
SEDs
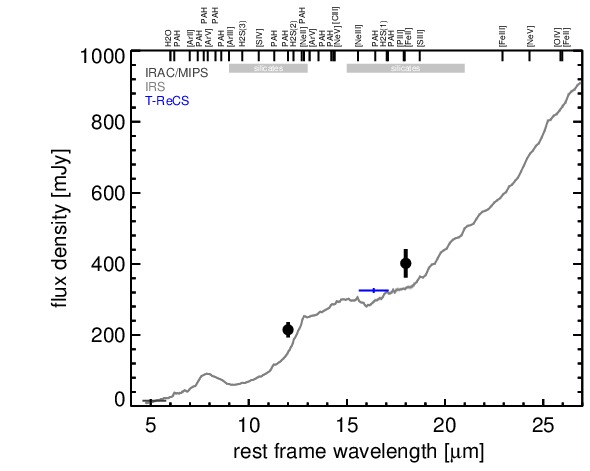
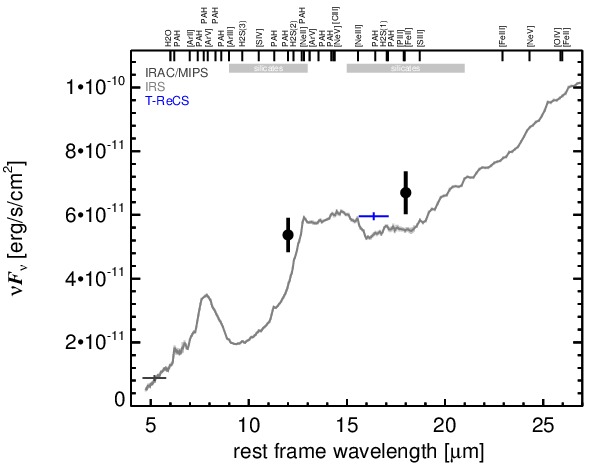
MIR SED. The description of the symbols in all the SED plots (where present) is the following: Grey crosses and solid lines mark the Spitzer/IRAC, MIPS and IRS data. The colour coding of the other symbols is as follows: green for COMICS, magenta for Michelle, blue for T-ReCS and red for VISIR data. Darker-coloured solid lines mark spectra of the corresponding instrument. The black filled circles mark the nuclear 12 and 18 micron continuum emission estimate from the data (where present). The ticks on the top axis mark positions of common MIR emission lines, while the light grey horizontal bars mark wavelength ranges affected by the silicate 10 and 18 micron features.