Sasmirala Individual Information for IRAS 05189-2524
Description
IRAS 05189-2524 is possibly a late stage merger system of two spirals [sanders_ultraluminous_1988] and is classified as an ultra-luminous infrared galaxy at a redshift of z = 0.0426 (D ~ 181 Mpc) hosting a Sy 2 nucleus [veilleux_optical_1995] with polarized broad emission lines [young_polarimetry_1996]. After its discovery with IRAS, this object was observed with Palomar 5 m [carico_iras_1988], MMT [maiolino_new_1995], ISO [klaas_infrared_2001, ramos_almeida_mid-infrared_2007]. The first high-angular resolution N-band images were obtained with Keck/MIRLIN in 1998 [soifer_high_2000], Palomar 5 m/MIRLIN in 1999 [gorjian_10_2004] and ESO 3.6 m/TIMMI2 in 2002 [siebenmorgen_mid-infrared_2004]. An unresolved MIR nucleus was detected in the Keck/MIRLIN and TIMMI2 images, while the source remained undetected in the Palomar 5 m/MIRLIN image. The Spitzer/IRAC 5.8 and 8.0 μm and MIPS 24 μm images also show a marginally resolved nucleus without any host emission. Note that the IRAC 8.0 μm PBCD image is saturated and not used analysed (but see [u_spectral_2012]). Our IRAC 5.8 and MIPS 24 μm photometry agrees with the values in [u_spectral_2012]. The IRS LR staring-mode spectrum shows silicate 10 and 18 μm absorption, PAH emission and a red spectral slope in νFν-space, and thus indicates significant star-formation contribution (see also [farrah_high-resolution_2007, wu_spitzer/irs_2009]). This was already pointed out by [dudley_new_1999] and [farrah_starburst_2003]. IRAS 05189-2524 was imaged with T-ReCS in the N filter in 2004 and with VISIR in two narrow N-band filters in 2010 (unpublished, to our knowledge). In all images a compact MIR nucleus without further host emission was detected. The nucleus is possibly marginally resolved in the N filter image (FWHM(major axis) ~ 0.47arcsec ~ 380 pc; PA~ 95∘), while no extension analysis is possible for the VISIR image because no appropriate standard star was observed. However, the PA in the VISIR images agrees with the one in the T-ReCS image, albeit with a smaller axis ratio. At least another epoch of subarcsecond-resolution MIR images is necessary to verify this extension. Our N filter photometry agrees with the value published in [videla_nuclear_2013], while both the T-ReCS and VISIR fluxes are consistent with the Spitzer spectrophotometry. We use the IRS spectrum to compute the nuclear 12 μm continuum emission estimate corrected for the silicate feature. Note that the nuclear MIR emission of IRAS 05189-2524 was resolved in interferometric observations with MIDI, which show that approximately half of the MIR emission originates from an extended region of ~ 30 pc size [tristram_parsec-scale_2009, burtscher_diversity_2013].
- [burtscher_diversity_2013] L. Burtscher, K. Meisenheimer, K. R. W. Tristram, W. Jaffe, S. F. Hönig, R. I. Davies, M. Kishimoto, J.-U. Pott, H. Röttgering, M. Schartmann, G. Weigelt, and S. Wolf. A diversity of dusty AGN tori. data release for the VLTI/MIDI AGN large program and first results for 23 galaxies . A&A , 558 pp. 149, October 2013.
- [carico_iras_1988] David P. Carico, D. B. Sanders, B. T. Soifer, J. H. Elias, K. Matthews, and G. Neugebauer. The IRAS bright galaxy sample. III - 1-10 micron observations and coadded IRAS data for galaxies with l(IR) equal to or greater than 10 to the 11th solar luminosities . AJ , 95 pp. 356–373, February 1988.
- [dudley_new_1999] C. C. Dudley. New 8-13mum spectroscopy of luminous and ultraluminous infrared galaxies . MNRAS , 307 pp. 553–576, August 1999.
- [farrah_high-resolution_2007] D. Farrah, J. Bernard-Salas, H. W. W. Spoon, B. T. Soifer, L. Armus, B. Brandl, V. Charmandaris, V. Desai, S. Higdon, D. Devost, and J. Houck. High-resolution mid-infrared spectroscopy of ultraluminous infrared galaxies . ApJ , 667 pp. 149–169, September 2007.
- [farrah_starburst_2003] D. Farrah, J. Afonso, A. Efstathiou, M. Rowan-Robinson, M. Fox, and D. Clements. Starburst and AGN activity in ultraluminous infrared galaxies . MNRAS , 343 pp. 585–607, August 2003.
- [gorjian_10_2004] V. Gorjian, M. W. Werner, T. H. Jarrett, D. M. Cole, and M. E. Ressler. 10 micron imaging of seyfert galaxies from the 12 micron sample . ApJ , 605 pp. 156–167, April 2004.
- [klaas_infrared_2001] U. Klaas, M. Haas, S. A. H. Müller, R. Chini, B. Schulz, I. Coulson, H. Hippelein, K. Wilke, M. Albrecht, and D. Lemke. Infrared to millimetre photometry of ultra-luminous IR galaxies: New evidence favouring a 3-stage dust model . A&A , 379 pp. 823–844, December 2001.
- [maiolino_new_1995] R. Maiolino, M. Ruiz, G. H. Rieke, and L. D. Keller. New constraints on the unified model of seyfert galaxies . ApJ , 446 pp. 561, June 1995.
- [ramos_almeida_mid-infrared_2007] C. Ramos Almeida, A. M. Pérez García, J. A. Acosta-Pulido, and J. M. Rodríguez Espinosa. The mid-infrared emission of seyfert galaxies: A new analysis of ISOCAM data . AJ , 134 pp. 2006–2019, November 2007.
- [sanders_ultraluminous_1988] D. B. Sanders, B. T. Soifer, J. H. Elias, B. F. Madore, K. Matthews, G. Neugebauer, and N. Z. Scoville. Ultraluminous infrared galaxies and the origin of quasars . ApJ , 325 pp. 74–91, February 1988.
- [siebenmorgen_mid-infrared_2004] R. Siebenmorgen, E. Krügel, and H. W. W. Spoon. Mid-infrared emission of galactic nuclei. TIMMI2 versus ISO observations and models . A&A , 414 pp. 123–139, January 2004.
- [soifer_high_2000] B. T. Soifer, G. Neugebauer, K. Matthews, E. Egami, E. E. Becklin, A. J. Weinberger, M. Ressler, M. W. Werner, A. S. Evans, N. Z. Scoville, J. A. Surace, and J. J. Condon. High resolution mid-infrared imaging of ultraluminous infrared galaxies . AJ , 119 pp. 509–523, February 2000.
- [tristram_parsec-scale_2009] K. R. W. Tristram, D. Raban, K. Meisenheimer, W. Jaffe, H. Röttgering, L. Burtscher, W. D. Cotton, U. Graser, Th. Henning, Ch. Leinert, B. Lopez, S. Morel, G. Perrin, and M. Wittkowski. Parsec-scale dust distributions in seyfert galaxies. results of the MIDI AGN snapshot survey . A&A , 502 pp. 67–84, July 2009.
- [u_spectral_2012] Vivian U, D. B. Sanders, J. M. Mazzarella, A. S. Evans, J. H. Howell, J. A. Surace, L. Armus, K. Iwasawa, D.-C. Kim, C. M. Casey, T. Vavilkin, M. Dufault, K. L. Larson, J. E. Barnes, B. H. P. Chan, D. T. Frayer, S. Haan, H. Inami, C. M. Ishida, J. S. Kartaltepe, J. L. Melbourne, and A. O. Petric. Spectral energy distributions of local luminous and ultraluminous infrared galaxies . ApJS , 203 pp. 9, November 2012.
- [veilleux_optical_1995] S. Veilleux, D.-C. Kim, D. B. Sanders, J. M. Mazzarella, and B. T. Soifer. Optical spectroscopy of luminous infrared galaxies. II. analysis of the nuclear and long-slit data . ApJS , 98 pp. 171, May 1995.
- [videla_nuclear_2013] Liza Videla, Paulina Lira, Heather Andrews, Almudena Alonso-Herrero, David M. Alexander, and Martin Ward. Nuclear infrared spectral energy distribution of type II active galactic nuclei . ApJS , 204 pp. 23, February 2013.
- [wu_spitzer/irs_2009] Yanling Wu, Vassilis Charmandaris, Jiasheng Huang, Luigi Spinoglio, and Silvia Tommasin. Spitzer/IRS 5-35 μm low-resolution spectroscopy of the 12 μm seyfert sample . ApJ , 701 pp. 658–676, August 2009.
- [young_polarimetry_1996] S. Young, J. H. Hough, A. Efstathiou, B. J. Wills, J. A. Bailey, M. J. Ward, and D. J. Axon. Polarimetry and modelling of narrow-line active galaxies . MNRAS , 281 pp. 1206–1242, August 1996.
Images
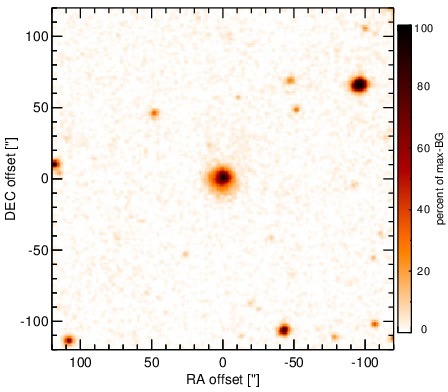
Optical image (DSS, red filter). Displayed are the central 4 arcmin with North being up and East to the left. The colour scaling is linear with white corresponding to the median background (BG) and black to the 0.01% pixels with the highest intensity.
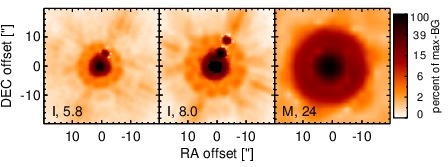
Spitzer MIR images. Displayed are the inner 40 arcsec with North being up and East to the left. The colour scaling is logarithmic with white corresponding to median BG and black to the 0.1% pixels with the highest intensity. The label in the bottom left states instrument and central wavelength of the filter in micron (I: IRAC, M: MIPS).
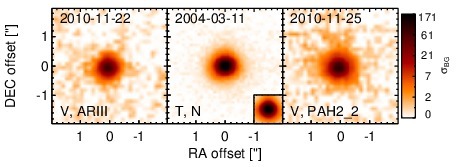
Subarcsecond-resolution MIR images sorted by increasing filter central wavelength. Displayed are the inner 4 arcsec with North being up and East to the left. The colour scaling is logarithmic with white corresponding to median BG and black to the 75% of the highest intensity of all images in units of sig_bg. The inset image (where present; either bottom or top right) shows the central arcsecond of the PSF from the calibrator star, scaled to match the science target. The labels in the bottom left state instrument and filter names (C: COMICS, M: Michelle, T: T-ReCS, V: VISIR).
SEDs
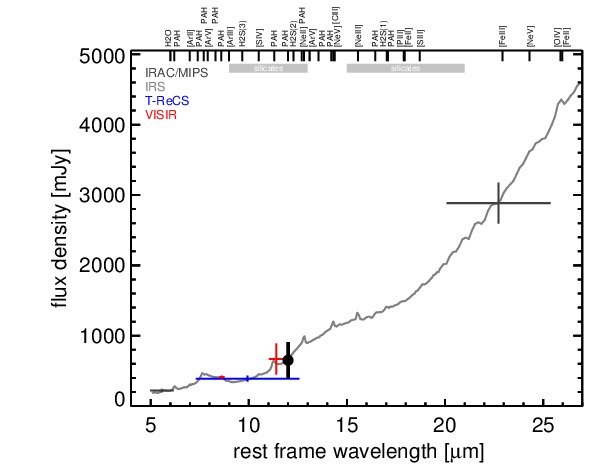
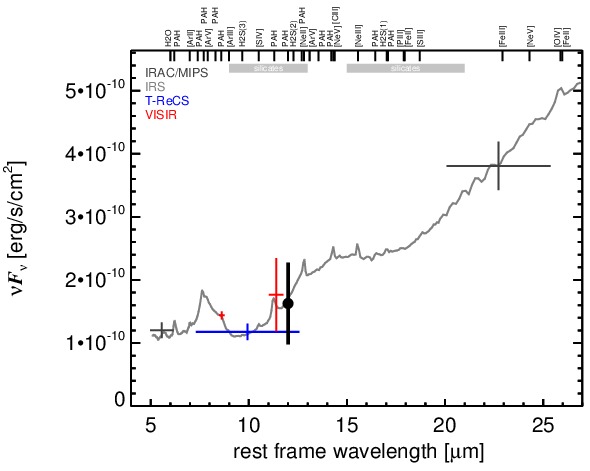
MIR SED. The description of the symbols in all the SED plots (where present) is the following: Grey crosses and solid lines mark the Spitzer/IRAC, MIPS and IRS data. The colour coding of the other symbols is as follows: green for COMICS, magenta for Michelle, blue for T-ReCS and red for VISIR data. Darker-coloured solid lines mark spectra of the corresponding instrument. The black filled circles mark the nuclear 12 and 18 micron continuum emission estimate from the data (where present). The ticks on the top axis mark positions of common MIR emission lines, while the light grey horizontal bars mark wavelength ranges affected by the silicate 10 and 18 micron features.