Sasmirala Individual Information for IRAS 11095-0238
Description
IRAS 11095-0238 is an ultra-luminous infrared galaxy at a redshift of z = 0.1066 (D ~ 480 Mpc) which might represent the late stage of a merger with two nuclei separated by ~ 0.5arcsec (~ 0.9 kpc; PA~ 45∘ [duc_southern_1997, bushouse_ultraluminous_2002]). Optically the object is classified either as LINER [veron-cetty_catalogue_2010] or as AGN/starburst composite [yuan_role_2010]. We conservatively treat this object as uncertain AGN/starburst composite in the absence of multiwavelength evidence for the presence of an AGN. IRAS 11095-0238 was observed with Spitzer/IRAC and IRS and appears rather point-like in the corresponding images. The IRS LR staring-mode spectrum shows extremely deep silicate 10 and 18 μm absorption, PAH emission and an extremely red spectral slope in νFν-space (see also [imanishi_spitzer_2007, farrah_high-resolution_2007]). Thus, the MIR SED appears very similar to IRAS 08572+3915 and suggests the presence of a deeply buried AGN as proposed by [imanishi_spitzer_2007]. The absence of any strong emission features indicates that putative MIR emission-line producing regions are heavily extincted (similar to, e.g., NGC 4945; [perez-beaupuits_deeply_2011]). COMICS observations of this object were performed in 2009 in the N8.8 filter (unpublished, to our knowledge), where a compact MIR nucleus was weakly detected. The second nucleus is possibly detected to the south-west but with less than 3σBG significance. The N8.8 flux of the detected nucleus is 24% lower than the Spitzer spectrophotometry and possibly indicates a lower PAH emission from this nucleus.
- [bushouse_ultraluminous_2002] H. A. Bushouse, K. D. Borne, L. Colina, R. A. Lucas, M. Rowan-Robinson, A. C. Baker, D. L. Clements, A. Lawrence, and S. Oliver. Ultraluminous infrared galaxies: Atlas of near-infrared images . ApJS , 138 pp. 1–18, January 2002.
- [duc_southern_1997] P.-A. Duc, I. F. Mirabel, and J. Maza. Southern ultraluminous infrared galaxies: an optical and infrared database . A&AS , 124 pp. 533–557, September 1997.
- [farrah_high-resolution_2007] D. Farrah, J. Bernard-Salas, H. W. W. Spoon, B. T. Soifer, L. Armus, B. Brandl, V. Charmandaris, V. Desai, S. Higdon, D. Devost, and J. Houck. High-resolution mid-infrared spectroscopy of ultraluminous infrared galaxies . ApJ , 667 pp. 149–169, September 2007.
- [imanishi_spitzer_2007] Masatoshi Imanishi, C. C. Dudley, Roberto Maiolino, Philip R. Maloney, Takao Nakagawa, and Guido Risaliti. A spitzer IRS low-resolution spectroscopic search for buried AGNs in nearby ultraluminous infrared galaxies: A constraint on geometry between energy sources and dust . ApJS , 171 pp. 72–100, July 2007.
- [perez-beaupuits_deeply_2011] J. P. Pérez-Beaupuits, H. W. W. Spoon, M. Spaans, and J. D. Smith. The deeply obscured AGN of NGC 4945. i. spitzer-IRS maps of [ne v], [ne II], h2 0-0 s(1), s(2), and other tracers . A&A , 533 pp. 56, September 2011.
- [veron-cetty_catalogue_2010] M.-P. Véron-Cetty and P. Véron. A catalogue of quasars and active nuclei: 13th edition . A&A , 518 pp. 10, July 2010.
- [yuan_role_2010] T.-T. Yuan, L. J. Kewley, and D. B. Sanders. The role of starburst-active galactic nucleus composites in luminous infrared galaxy mergers: Insights from the new optical classification scheme . ApJ , 709 pp. 884–911, February 2010.
Images

Optical image (DSS, red filter). Displayed are the central 4 arcmin with North being up and East to the left. The colour scaling is linear with white corresponding to the median background (BG) and black to the 0.01% pixels with the highest intensity.
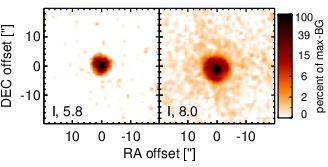
Spitzer MIR images. Displayed are the inner 40 arcsec with North being up and East to the left. The colour scaling is logarithmic with white corresponding to median BG and black to the 0.1% pixels with the highest intensity. The label in the bottom left states instrument and central wavelength of the filter in micron (I: IRAC, M: MIPS).
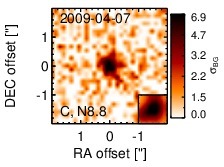
Subarcsecond-resolution MIR images sorted by increasing filter central wavelength. Displayed are the inner 4 arcsec with North being up and East to the left. The colour scaling is logarithmic with white corresponding to median BG and black to the 75% of the highest intensity of all images in units of sig_bg. The inset image (where present; either bottom or top right) shows the central arcsecond of the PSF from the calibrator star, scaled to match the science target. The labels in the bottom left state instrument and filter names (C: COMICS, M: Michelle, T: T-ReCS, V: VISIR).
SEDs
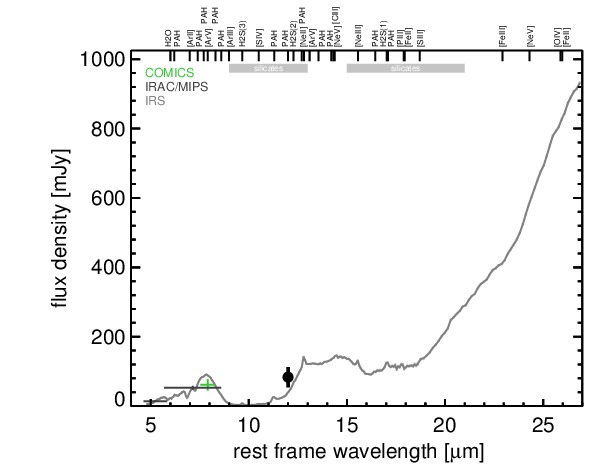
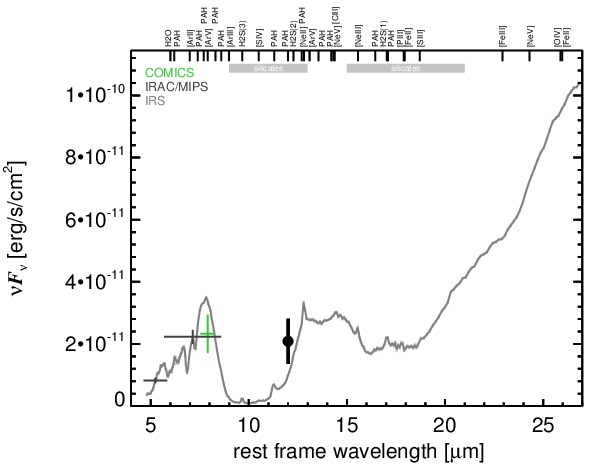
MIR SED. The description of the symbols in all the SED plots (where present) is the following: Grey crosses and solid lines mark the Spitzer/IRAC, MIPS and IRS data. The colour coding of the other symbols is as follows: green for COMICS, magenta for Michelle, blue for T-ReCS and red for VISIR data. Darker-coloured solid lines mark spectra of the corresponding instrument. The black filled circles mark the nuclear 12 and 18 micron continuum emission estimate from the data (where present). The ticks on the top axis mark positions of common MIR emission lines, while the light grey horizontal bars mark wavelength ranges affected by the silicate 10 and 18 micron features.