Sasmirala Individual Information for IRAS 15250+3609
Description
IRAS 15250+3609 is a peculiar ultra-luminous infrared galaxy at a redshift of z = 0.0552 (D ~238 Mpc) with an active nucleus optically classified as a composite LINER and H II [kim_optical_1995, veilleux_optical_1995, veilleux_new_1999] and AGN/starburst composite [farrah_starburst_2003, yuan_role_2010]. We conservatively treat this object as uncertain AGN/starburst composite in the absence of multiwavelength evidence for the presence of an AGN. A putative second, fainter nucleus 0.7arcsec (~ 0.8 kpc) south-east is visible in the NICMOS images [scoville_nicmos_2000]. After IRAS, the object was observed in the MIR with Palomar 5 m [carico_iras_1988], with ISO/ISOPHOT and ISOCAM [klaas_infrared_2001, siebenmorgen_mid_2001], and then with Spitzer/IRAC, IRS and MIPS. The nucleus of IRAS 15250+3609 remains nearly unresolved in all images. The IRS LR staring-mode spectrum shows extremely deep silicate 10 and 18 μm absorption, PAH emission and an extremely red spectral slope in νFν-space (see also [spoon_detection_2006, farrah_high-resolution_2007, imanishi_subaru_2011]). Thus, the MIR SED appears very similar to IRAS 11095-0238 and suggests the presence of a deeply buried AGN with significant star formation as proposed by [farrah_starburst_2003]. The absence of any strong emission features indicates that putative MIR emission-line producing regions are heavily extincted (similar to, e.g., NGC 4945; [perez-beaupuits_deeply_2011]). COMICS observations of this source were performed in 2009 in the N8.8 and Q17.7 filters and a compact MIR nucleus is weakly detected in both images. The PSF seems to have been very unstable during these observations, and together with the low S/N, no statement about the nuclear extension can be made. The measured Q17.7 flux is significantly higher than the value published in [imanishi_subaru_2011] but the N8.8 and Q17.7 fluxes agrees with the Spitzer spectrophotometry well. Therefore, we use the IRS spectrum to compute the 12 and 18 μm continuum emission estimates corrected for the silicate features.
- [carico_iras_1988] David P. Carico, D. B. Sanders, B. T. Soifer, J. H. Elias, K. Matthews, and G. Neugebauer. The IRAS bright galaxy sample. III - 1-10 micron observations and coadded IRAS data for galaxies with l(IR) equal to or greater than 10 to the 11th solar luminosities . AJ , 95 pp. 356–373, February 1988.
- [farrah_high-resolution_2007] D. Farrah, J. Bernard-Salas, H. W. W. Spoon, B. T. Soifer, L. Armus, B. Brandl, V. Charmandaris, V. Desai, S. Higdon, D. Devost, and J. Houck. High-resolution mid-infrared spectroscopy of ultraluminous infrared galaxies . ApJ , 667 pp. 149–169, September 2007.
- [farrah_starburst_2003] D. Farrah, J. Afonso, A. Efstathiou, M. Rowan-Robinson, M. Fox, and D. Clements. Starburst and AGN activity in ultraluminous infrared galaxies . MNRAS , 343 pp. 585–607, August 2003.
- [imanishi_subaru_2011] Masatoshi Imanishi, Keisuke Imase, Nagisa Oi, and Kohei Ichikawa. Subaru and gemini high spatial resolution infrared 18 μm imaging observations of nearby luminous infrared galaxies . AJ , 141 pp. 156, May 2011.
- [kim_optical_1995] D.-C. Kim, D. B. Sanders, S. Veilleux, J. M. Mazzarella, and B. T. Soifer. Optical spectroscopy of luminous infrared galaxies. i. nuclear data . ApJS , 98 pp. 129, May 1995.
- [klaas_infrared_2001] U. Klaas, M. Haas, S. A. H. Müller, R. Chini, B. Schulz, I. Coulson, H. Hippelein, K. Wilke, M. Albrecht, and D. Lemke. Infrared to millimetre photometry of ultra-luminous IR galaxies: New evidence favouring a 3-stage dust model . A&A , 379 pp. 823–844, December 2001.
- [perez-beaupuits_deeply_2011] J. P. Pérez-Beaupuits, H. W. W. Spoon, M. Spaans, and J. D. Smith. The deeply obscured AGN of NGC 4945. i. spitzer-IRS maps of [ne v], [ne II], h2 0-0 s(1), s(2), and other tracers . A&A , 533 pp. 56, September 2011.
- [scoville_nicmos_2000] N. Z. Scoville, A. S. Evans, R. Thompson, M. Rieke, D. C. Hines, F. J. Low, N. Dinshaw, J. A. Surace, and L. Armus. NICMOS imaging of infrared-luminous galaxies . AJ , 119 pp. 991–1061, March 2000.
- [siebenmorgen_mid_2001] R. Siebenmorgen and A. Efstathiou. Mid infrared polarisation of ultraluminous infrared galaxies . A&A , 376 pp. L35–L38, September 2001.
- [spoon_detection_2006] H. W. W. Spoon, A. G. G. M. Tielens, L. Armus, G. C. Sloan, B. Sargent, J. Cami, V. Charmandaris, J. R. Houck, and B. T. Soifer. The detection of crystalline silicates in ultraluminous infrared galaxies . ApJ , 638 pp. 759–765, February 2006.
- [veilleux_new_1999] Sylvain Veilleux, D. B. Sanders, and D.-C. Kim. New results from a near-infrared search for hidden broad-line regions in ultraluminous infrared galaxies . ApJ , 522 pp. 139–156, September 1999.
- [veilleux_optical_1995] S. Veilleux, D.-C. Kim, D. B. Sanders, J. M. Mazzarella, and B. T. Soifer. Optical spectroscopy of luminous infrared galaxies. II. analysis of the nuclear and long-slit data . ApJS , 98 pp. 171, May 1995.
- [yuan_role_2010] T.-T. Yuan, L. J. Kewley, and D. B. Sanders. The role of starburst-active galactic nucleus composites in luminous infrared galaxy mergers: Insights from the new optical classification scheme . ApJ , 709 pp. 884–911, February 2010.
Images
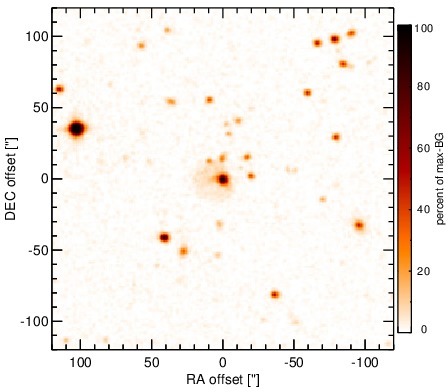
Optical image (DSS, red filter). Displayed are the central 4 arcmin with North being up and East to the left. The colour scaling is linear with white corresponding to the median background (BG) and black to the 0.01% pixels with the highest intensity.
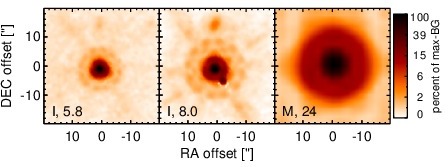
Spitzer MIR images. Displayed are the inner 40 arcsec with North being up and East to the left. The colour scaling is logarithmic with white corresponding to median BG and black to the 0.1% pixels with the highest intensity. The label in the bottom left states instrument and central wavelength of the filter in micron (I: IRAC, M: MIPS).
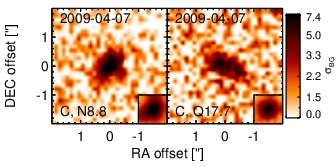
Subarcsecond-resolution MIR images sorted by increasing filter central wavelength. Displayed are the inner 4 arcsec with North being up and East to the left. The colour scaling is logarithmic with white corresponding to median BG and black to the 75% of the highest intensity of all images in units of sig_bg. The inset image (where present; either bottom or top right) shows the central arcsecond of the PSF from the calibrator star, scaled to match the science target. The labels in the bottom left state instrument and filter names (C: COMICS, M: Michelle, T: T-ReCS, V: VISIR).
SEDs
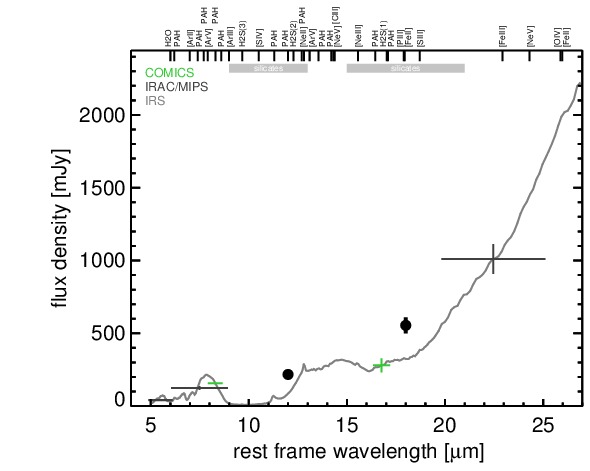
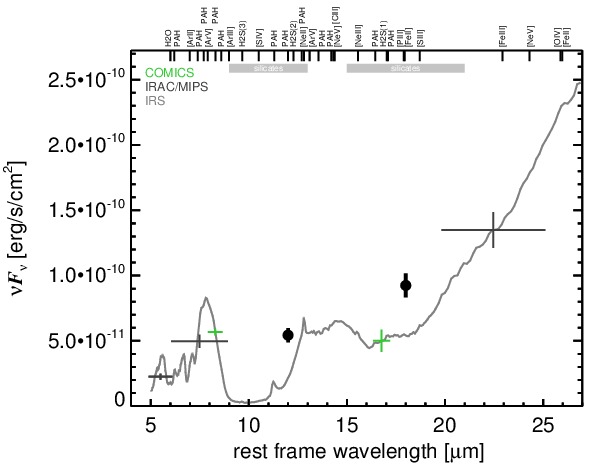
MIR SED. The description of the symbols in all the SED plots (where present) is the following: Grey crosses and solid lines mark the Spitzer/IRAC, MIPS and IRS data. The colour coding of the other symbols is as follows: green for COMICS, magenta for Michelle, blue for T-ReCS and red for VISIR data. Darker-coloured solid lines mark spectra of the corresponding instrument. The black filled circles mark the nuclear 12 and 18 micron continuum emission estimate from the data (where present). The ticks on the top axis mark positions of common MIR emission lines, while the light grey horizontal bars mark wavelength ranges affected by the silicate 10 and 18 micron features.