Sasmirala Individual Information for LEDA 549777
Description
The galaxy LEDA 549777 at a redshift of z = 0.061 (D ~ 258 Mpc) was discovered to contain an AGN with SWIFT/BAT observations [tueller_swift_2008], which thus belongs to the 9 month BAT AGN sample. It was classified as a Sy 2.0 by [parisi_accurate_2009]. No Spitzer observations have targeted LEDA 549777. It appears as a compact source in the WISE images except the band 3 image, which shows a faint ring-like structure with ~ 1arcmimin ~ 80 kpc diameter surrounding the nucleus. We observed LEDA 549777 with VISIR in the NEII_2 filter in 2009 and weakly detected a compact MIR source. The low S/N of the detection and lack of data does not allow us to determine the nuclear extension at subarcsecond scales in the MIR. The nuclear NEII_2 flux is consistent with the WISE band 3 (~ 12 μm) flux.
- [parisi_accurate_2009] P. Parisi, N. Masetti, E. Jiménez-Bailón, V. Chavushyan, A. Malizia, R. Landi, M. Molina, M. Fiocchi, E. Palazzi, L. Bassani, A. Bazzano, A. J. Bird, A. J. Dean, G. Galaz, E. Mason, D. Minniti, L. Morelli, J. B. Stephen, and P. Ubertini. Accurate classification of 17 AGNs detected with Swift/BAT . A&A , 507 pp. 1345–1358, December 2009.
- [tueller_swift_2008] J. Tueller, R. F. Mushotzky, S. Barthelmy, J. K. Cannizzo, N. Gehrels, C. B. Markwardt, G. K. Skinner, and L. M. Winter. Swift BAT survey of AGNs . ApJ , 681 pp. 113–127, July 2008.
Images
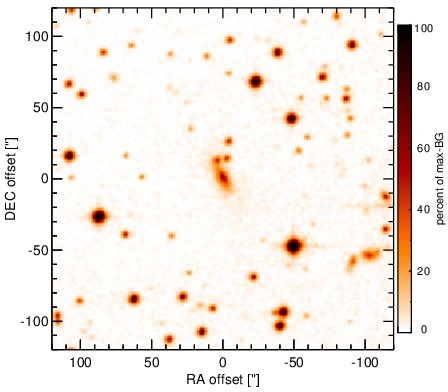
Optical image (DSS, red filter). Displayed are the central 4 arcmin with North being up and East to the left. The colour scaling is linear with white corresponding to the median background (BG) and black to the 0.01% pixels with the highest intensity.
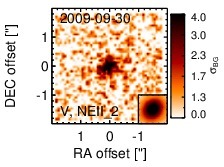
Subarcsecond-resolution MIR images sorted by increasing filter central wavelength. Displayed are the inner 4 arcsec with North being up and East to the left. The colour scaling is logarithmic with white corresponding to median BG and black to the 75% of the highest intensity of all images in units of sig_bg. The inset image (where present; either bottom or top right) shows the central arcsecond of the PSF from the calibrator star, scaled to match the science target. The labels in the bottom left state instrument and filter names (C: COMICS, M: Michelle, T: T-ReCS, V: VISIR).
SEDs
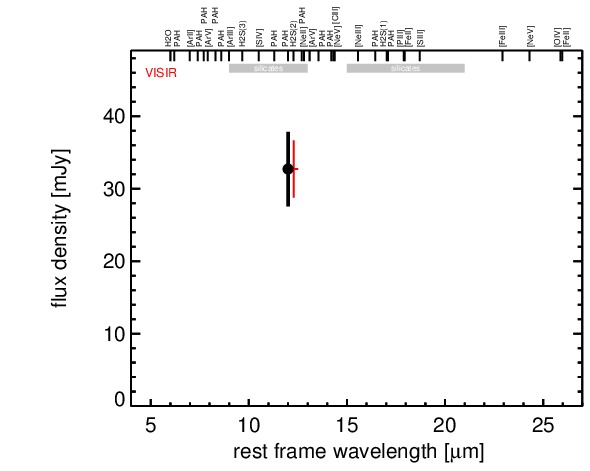
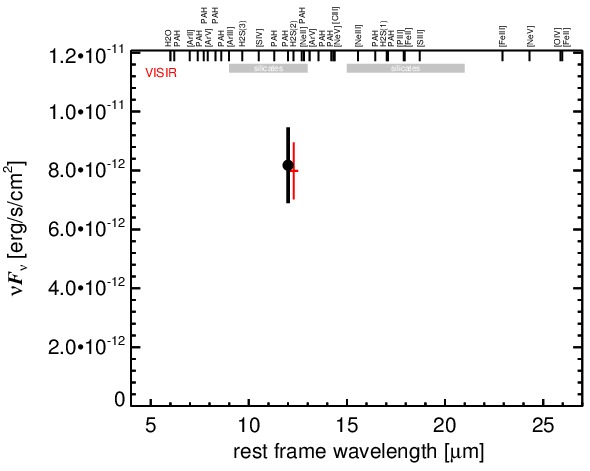
MIR SED. The description of the symbols in all the SED plots (where present) is the following: Grey crosses and solid lines mark the Spitzer/IRAC, MIPS and IRS data. The colour coding of the other symbols is as follows: green for COMICS, magenta for Michelle, blue for T-ReCS and red for VISIR data. Darker-coloured solid lines mark spectra of the corresponding instrument. The black filled circles mark the nuclear 12 and 18 micron continuum emission estimate from the data (where present). The ticks on the top axis mark positions of common MIR emission lines, while the light grey horizontal bars mark wavelength ranges affected by the silicate 10 and 18 micron features.