Sasmirala Individual Information for M51a
Description
M51a is a face-on grand-design spiral galaxy at a distance of D = 8.09 ± 0.87 Mpc (NED redshift-independent median) interacting with the smaller M51b galaxy. It hosts a Sy 2 nucleus [veron-cetty_catalogue_2010] sometimes also classified as a LINER [heckman_optical_1980] and possesses a biconical NLR, a weak radio jet [ford_bubbles_1985, ho_radio_2001] and a nuclear water maser [hagiwara_water_2001, hagiwara_low-luminosity_2007]. The first MIR observations of M51a were performed by [kleinmann_infrared_1970] and [rieke_10_1978], whereas the nucleus remained undetected. The IRAS and ISO observations on the other hand were dominated by the circum-nuclear star formation (e.g., [sauvage_isocam_1996, roussel_atlas_2001, forster_schreiber_warm_2004]). The nucleus of M51a remained also undetected in the first subarcsecond MIR observations with Palomar 5 m/MIRLIN [gorjian_10_2004]. Finally, the Spitzer/IRAC and MIPS images show a compact nucleus in the centre of the extended spiral emission of M51a. Because we measure the photometry of the nuclear component only, our IRAC 5.8 and 8.0 μm and MIPS 24 μm fluxes are significantly lower than the values in the literature (e.g., [dale_infrared_2005, munoz-mateos_radial_2009]). Owing to the complex emission morphology of M51a in the MIR, the IRS LR mapping-mode PBCD spectrum is not reliable. However, it roughly matches the IRAC and MIPS photometry and shows strong PAH emission with possibly weak silicate absorption and a red spectral slope in νFν-space, indicating star formation in the central 4arcsec~ 160 pc region (see e.g., [smith_mid-infrared_2007, wu_spitzer/irs_2009, goulding_towards_2009] for accurate versions). We observed M51a with Michelle in 2010 in two N-band filters and detected a possibly marginally resolved nucleus but no further host emission (FWHM ~ 0.8arcsec ~ 31 pc). However, the observations were made under bad conditions and at least a second epoch is required to verify this extension. The corresponding nuclear photometry is ~ 73% lower than the IRS spectrum but still consistent with pure star formation, which also matches the detection of PAH 3.3 μm emission in the inner ~ 0.8arcsec ~ 31 pc of M51a [oi_comparison_2010].
- [dale_infrared_2005] D. A. Dale, G. J. Bendo, C. W. Engelbracht, K. D. Gordon, M. W. Regan, L. Armus, J. M. Cannon, D. Calzetti, B. T. Draine, G. Helou, R. D. Joseph, R. C. Kennicutt, A. Li, E. J. Murphy, H. Roussel, F. Walter, H. M. Hanson, D. J. Hollenbach, T. H. Jarrett, L. J. Kewley, C. A. Lamanna, C. Leitherer, M. J. Meyer, G. H. Rieke, M. J. Rieke, K. Sheth, J. D. T. Smith, and M. D. Thornley. Infrared spectral energy distributions of nearby galaxies . ApJ , 633 pp. 857–870, November 2005.
- [ford_bubbles_1985] H. C. Ford, P. C. Crane, G. H. Jacoby, D. G. Lawrie, and J. M. van der Hulst. Bubbles and jets in the center of m51 . ApJ , 293 pp. 132–147, June 1985.
- [forster_schreiber_warm_2004] N. M. Förster Schreiber, H. Roussel, M. Sauvage, and V. Charmandaris. Warm dust and aromatic bands as quantitative probes of star-formation activity . A&A , 419 pp. 501–516, May 2004.
- [gorjian_10_2004] V. Gorjian, M. W. Werner, T. H. Jarrett, D. M. Cole, and M. E. Ressler. 10 micron imaging of seyfert galaxies from the 12 micron sample . ApJ , 605 pp. 156–167, April 2004.
- [goulding_towards_2009] A. D. Goulding and D. M. Alexander. Towards a complete census of AGN in nearby galaxies: a large population of optically unidentified AGN . MNRAS , 398 pp. 1165–1193, September 2009.
- [hagiwara_low-luminosity_2007] Yoshiaki Hagiwara. Low-luminosity extragalactic water masers toward m82, m51, and NGC 4051 . AJ , 133 pp. 1176–1186, March 2007.
- [hagiwara_water_2001] Yoshiaki Hagiwara, Christian Henkel, Karl M. Menten, and Naomasa Nakai. Water maser emission from the active nucleus in m51 . ApJL , 560 pp. L37–L40, October 2001.
- [heckman_optical_1980] T. M. Heckman. An optical and radio survey of the nuclei of bright galaxies - activity in normal galactic nuclei . A&A , 87 pp. 152–164, July 1980.
- [ho_radio_2001] Luis C. Ho and James S. Ulvestad. Radio continuum survey of an optically selected sample of nearby seyfert galaxies . ApJS , 133 pp. 77–118, March 2001.
- [kleinmann_infrared_1970] D. E. Kleinmann and F. J. Low. Infrared observations of galaxies and of the extended nucleus in m82 . ApJL , 161 pp. L203, September 1970.
- [munoz-mateos_radial_2009] J. C. Muñoz-Mateos, A. Gil de Paz, J. Zamorano, S. Boissier, D. A. Dale, P. G. Pérez-González, J. Gallego, B. F. Madore, G. Bendo, A. Boselli, V. Buat, D. Calzetti, J. Moustakas, and R. C. Kennicutt. Radial distribution of stars, gas, and dust in SINGS galaxies. i. surface photometry and morphology . ApJ , 703 pp. 1569–1596, October 2009.
- [oi_comparison_2010] Nagisa Oi, Masatoshi Imanishi, and Keisuke Imase. Comparison of AGN and nuclear starburst activity in seyfert 1 and 2 galaxies over a wide luminosity range based on near-infrared 2-4μm spectroscopy . PASJ , 62 pp. 1509, December 2010.
- [rieke_10_1978] G. H. Rieke and M. J. Lebofsky. 10 micron observations of bright galaxies . ApJL , 220 pp. L37–L41, March 1978.
- [roussel_atlas_2001] H. Roussel, L. Vigroux, A. Bosma, M. Sauvage, C. Bonoli, P. Gallais, T. Hawarden, J. Lequeux, S. Madden, and P. Mazzei. An atlas of mid-infrared dust emission in spiral galaxies . A&A , 369 pp. 473–509, April 2001.
- [sauvage_isocam_1996] M. Sauvage, J. Blommaert, F. Boulanger, C. J. Cesarsky, D. A. Cesarsky, F. X. Desert, D. Elbaz, P. Gallais, G. Joncas, L. Metcalfe, K. Okumura, S. Ott, R. Siebenmorgen, J. L. Starck, D. Tran, and L. Vigroux. ISOCAM mapping of the whirlpool galaxy m51. . A&A , 315 pp. L89–L92, November 1996.
- [smith_mid-infrared_2007] J. D. T. Smith, B. T. Draine, D. A. Dale, J. Moustakas, R. C. Kennicutt, G. Helou, L. Armus, H. Roussel, K. Sheth, G. J. Bendo, B. A. Buckalew, D. Calzetti, C. W. Engelbracht, K. D. Gordon, D. J. Hollenbach, A. Li, S. Malhotra, E. J. Murphy, and F. Walter. The mid-infrared spectrum of star-forming galaxies: Global properties of polycyclic aromatic hydrocarbon emission . ApJ , 656 pp. 770–791, February 2007.
- [veron-cetty_catalogue_2010] M.-P. Véron-Cetty and P. Véron. A catalogue of quasars and active nuclei: 13th edition . A&A , 518 pp. 10, July 2010.
- [wu_spitzer/irs_2009] Yanling Wu, Vassilis Charmandaris, Jiasheng Huang, Luigi Spinoglio, and Silvia Tommasin. Spitzer/IRS 5-35 μm low-resolution spectroscopy of the 12 μm seyfert sample . ApJ , 701 pp. 658–676, August 2009.
Images
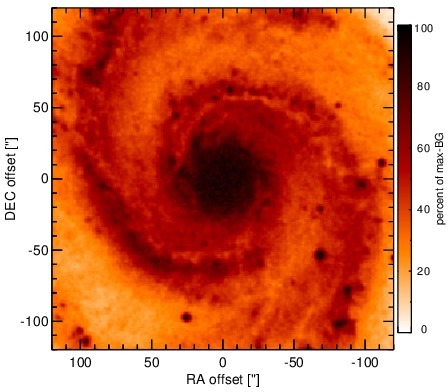
Optical image (DSS, red filter). Displayed are the central 4 arcmin with North being up and East to the left. The colour scaling is linear with white corresponding to the median background (BG) and black to the 0.01% pixels with the highest intensity.
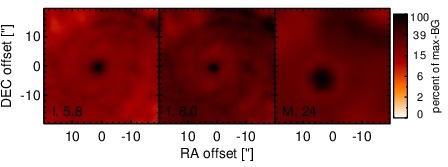
Spitzer MIR images. Displayed are the inner 40 arcsec with North being up and East to the left. The colour scaling is logarithmic with white corresponding to median BG and black to the 0.1% pixels with the highest intensity. The label in the bottom left states instrument and central wavelength of the filter in micron (I: IRAC, M: MIPS).
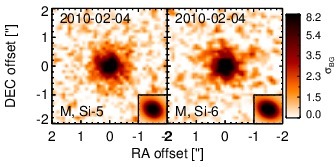
Subarcsecond-resolution MIR images sorted by increasing filter central wavelength. Displayed are the inner 4 arcsec with North being up and East to the left. The colour scaling is logarithmic with white corresponding to median BG and black to the 75% of the highest intensity of all images in units of sig_bg. The inset image (where present; either bottom or top right) shows the central arcsecond of the PSF from the calibrator star, scaled to match the science target. The labels in the bottom left state instrument and filter names (C: COMICS, M: Michelle, T: T-ReCS, V: VISIR).
SEDs
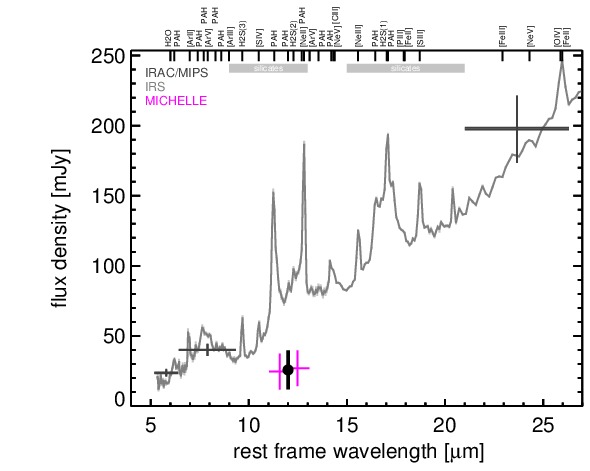
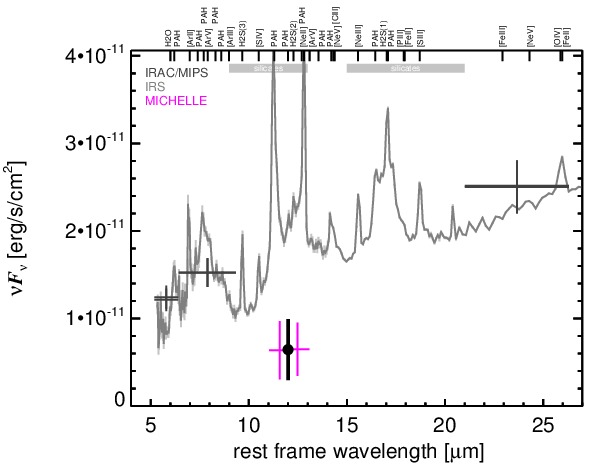
MIR SED. The description of the symbols in all the SED plots (where present) is the following: Grey crosses and solid lines mark the Spitzer/IRAC, MIPS and IRS data. The colour coding of the other symbols is as follows: green for COMICS, magenta for Michelle, blue for T-ReCS and red for VISIR data. Darker-coloured solid lines mark spectra of the corresponding instrument. The black filled circles mark the nuclear 12 and 18 micron continuum emission estimate from the data (where present). The ticks on the top axis mark positions of common MIR emission lines, while the light grey horizontal bars mark wavelength ranges affected by the silicate 10 and 18 micron features.