Sasmirala Individual Information for M81
Description
M81 is a nearby grand-design spiral galaxy at a distance of D = 3,6 ± 0.5 Mpc (NED redshift-independent median) with one of the intrinsically weakest known AGN, which is also a flat-spectrum radio source (e.g., [ho_radio_2001]). It exhibits both LINER and Sy 1.8 characteristics [filippenko_detailed_1988, ho_new_1996] and extraordinary low obscuration (NH ~ 5 ⋅ 1020 cm-2; [page_x-ray_2003]). Motivated by its similarity to Sgr A*, an extensive multiwavelength campaign was performed on M 81 by [markoff_results_2008] in order to compare and characterize SED and the short-term (daily) variability that occurs in this object (in addition to the yearly variations). They found striking similarities to the hard state of X-ray binaries. The first MIR observations of M81 were performed by [kleinmann_infrared_1970], [rieke_10_1978] and [dyck_photometry_1978], followed by first subarcsecond-resolution N-band imaging with Palomar 5 m/MIRLIN in 1999 [grossan_high-resolution_2001, gorjian_10_2004] with a possibly resolved nucleus and a significantly higher than the previous measurements. M81 was followed up by [soifer_high_2004] with Keck/LWS in the SIC filter in 2000 (and 2002 but under non-photometric conditions by [grossan_high_2004]), who find the nucleus marginally resolved (FWHM= 0.36arcsec ~ 7 pc). Spitzer/IRAC has observed M81 seven times between 2003 and 2005 and Spitzer/MIPS was used for three observations between 2003 and 2004. In all cases, a compact nucleus embedded in extended host emission was detected (see also [willner_infrared_2004, smith_anomalous_2010]). Because we measure the photometry of the nuclear component only, our IRAC 5.8 and 8.0 μm and MIPS 24 μm fluxes are significantly lower than the values in the literature (e.g., [dale_infrared_2005, munoz-mateos_radial_2009]). However, our nuclear IRAC fluxes are a factor of two higher than those of [willner_infrared_2004] for unknown reasons, but are on the other hand roughly consistent with the Spitzer/IRS LR mapping mode spectrum. The latter shows very strong silicate emission and also a prominent PAH 11.3 μm feature but no other significant PAH features (see e.g., [smith_anomalous_2010, wu_spitzer/irs_2009, dale_spitzer_2009, mason_nuclear_2012]). The steep spectral slope at the short wavelength side of the silicate 10 μm is most likely the cause for the apparent flux variations reported earlier as already noted by [smith_anomalous_2010].
We observed the nucleus of M81 with Michelle in two N-band filters in 2010. Additional Michelle imaging in three N and one Q-band filters was performed in 2011 [mason_nuclear_2012]. A compact MIR nucleus was detected in all Michelle images, which appears marginally resolved in our Si-5 and Si-6 images but not in the Si-2 image from 2011 which shows the highest angular resolution. Therefore, it remains uncertain, whether the nucleus of M81 is in general resolved at subarcsecond resolution in the MIR but the results of [mason_nuclear_2012] suggest it to be rather unresolved. Our nuclear flux measurements are on average ~ 24% lower than the Spitzer spectrophotometry and consistent with previous measurements but for unknown reasons systematically ~ 20% higher than the values of [mason_nuclear_2012] for the same data. The silicate 10 μm feature is reproduced with the subarcsecond data and thus originates in the projected central ~ 7 pc of the nucleus of M81. Therefore, we use the IRS spectrum to correct our 12 and 18 μm continuum emission estimate for the silicate features.
- [dale_infrared_2005] D. A. Dale, G. J. Bendo, C. W. Engelbracht, K. D. Gordon, M. W. Regan, L. Armus, J. M. Cannon, D. Calzetti, B. T. Draine, G. Helou, R. D. Joseph, R. C. Kennicutt, A. Li, E. J. Murphy, H. Roussel, F. Walter, H. M. Hanson, D. J. Hollenbach, T. H. Jarrett, L. J. Kewley, C. A. Lamanna, C. Leitherer, M. J. Meyer, G. H. Rieke, M. J. Rieke, K. Sheth, J. D. T. Smith, and M. D. Thornley. Infrared spectral energy distributions of nearby galaxies . ApJ , 633 pp. 857–870, November 2005.
- [dale_spitzer_2009] D. A. Dale, J. D. T. Smith, E. A. Schlawin, L. Armus, B. A. Buckalew, S. A. Cohen, G. Helou, T. H. Jarrett, L. C. Johnson, J. Moustakas, E. J. Murphy, H. Roussel, K. Sheth, S. Staudaher, C. Bot, D. Calzetti, C. W. Engelbracht, K. D. Gordon, D. J. Hollenbach, R. C. Kennicutt, and S. Malhotra. The spitzer infrared nearby galaxies survey: A high-resolution spectroscopy anthology . ApJ , 693 pp. 1821–1834, March 2009.
- [dyck_photometry_1978] H. M. Dyck, E. E. Becklin, and R. W. Capps. Photometry of spiral galaxy nuclei at 10 μm and 20 μm . In BAAS , volume 10 of BAAS , page 422, March 1978.
- [filippenko_detailed_1988] Alexei V. Filippenko and Wallace L. W. Sargent. A detailed study of the emission lines in the seyfert 1 nucleus of m81 . ApJ , 324 pp. 134–153, January 1988.
- [gorjian_10_2004] V. Gorjian, M. W. Werner, T. H. Jarrett, D. M. Cole, and M. E. Ressler. 10 micron imaging of seyfert galaxies from the 12 micron sample . ApJ , 605 pp. 156–167, April 2004.
- [grossan_high-resolution_2001] Bruce Grossan, Varoujan Gorjian, Michael Werner, and Michael Ressler. High-resolution mid-infrared images of the nucleus of m81 . ApJ , 563 pp. 687–693, December 2001.
- [grossan_high_2004] Bruce Grossan. High resolution mid-infrared observations of low-luminosity AGN with the keck telescope and LWS . astro-ph/0405190 , May 2004.
- [ho_new_1996] Luis C. Ho, Alexei V. Filippenko, and Wallace L. W. Sargent. New insights into the physical nature of LINERs from a multiwavelength analysis of the nucleus of m81 . ApJ , 462 pp. 183, May 1996.
- [ho_radio_2001] Luis C. Ho and James S. Ulvestad. Radio continuum survey of an optically selected sample of nearby seyfert galaxies . ApJS , 133 pp. 77–118, March 2001.
- [kleinmann_infrared_1970] D. E. Kleinmann and F. J. Low. Infrared observations of galaxies and of the extended nucleus in m82 . ApJL , 161 pp. L203, September 1970.
- [markoff_results_2008] Sera Markoff, Michael Nowak, Andrew Young, Herman L. Marshall, Claude R. Canizares, Alison Peck, Melanie Krips, Glen Petitpas, Rainer Schödel, Geoffrey C. Bower, Poonam Chandra, Alak Ray, Michael Muno, Sarah Gallagher, Seth Hornstein, and Chi C. Cheung. Results from an extensive simultaneous broadband campaign on the underluminous active nucleus m81*: Further evidence for mass-scaling accretion in black holes . ApJ , 681 pp. 905–924, July 2008.
- [mason_nuclear_2012] R. E. Mason, E. Lopez-Rodriguez, C. Packham, A. Alonso-Herrero, N. A. Levenson, J. Radomski, C. Ramos Almeida, L. Colina, M. Elitzur, I. Aretxaga, P. F. Roche, and N. Oi. The nuclear infrared emission of low-luminosity active galactic nuclei. AJ , 144 pp. 11, July 2012.
- [munoz-mateos_radial_2009] J. C. Muñoz-Mateos, A. Gil de Paz, J. Zamorano, S. Boissier, D. A. Dale, P. G. Pérez-González, J. Gallego, B. F. Madore, G. Bendo, A. Boselli, V. Buat, D. Calzetti, J. Moustakas, and R. C. Kennicutt. Radial distribution of stars, gas, and dust in SINGS galaxies. i. surface photometry and morphology . ApJ , 703 pp. 1569–1596, October 2009.
- [page_x-ray_2003] M. J. Page, A. A. Breeveld, R. Soria, K. Wu, G. Branduardi-Raymont, K. O. Mason, R. L. C. Starling, and S. Zane. X-ray emission line gas in the LINER galaxy m 81 . A&A , 400 pp. 145–151, March 2003.
- [rieke_10_1978] G. H. Rieke and M. J. Lebofsky. 10 micron observations of bright galaxies . ApJL , 220 pp. L37–L41, March 1978.
- [smith_anomalous_2010] Howard A. Smith, Aigen Li, M. P. Li, M. Köhler, M. L. N. Ashby, G. G. Fazio, J.-S. Huang, M. Marengo, Z. Wang, S. Willner, A. Zezas, L. Spinoglio, and Y. L. Wu. Anomalous silicate dust emission in the type 1 liner nucleus of m81 . ApJ , 716 pp. 490–503, June 2010.
- [soifer_high_2004] B. T. Soifer, G. Neugebauer, K. Matthews, E. Egami, and L. Armus. High spatial resolution mid-infrared observations of five seyfert galaxies . PASP , 116 pp. 493–496, June 2004.
- [willner_infrared_2004] S. P. Willner, M. L. N. Ashby, P. Barmby, G. G. Fazio, M. Pahre, H. A. Smith, Robert C. Kennicutt, Daniela Calzetti, Daniel A. Dale, B. T. Draine, Michael W. Regan, S. Malhotra, Michele D. Thornley, P. N. Appleton, D. Frayer, G. Helou, S. Stolovy, and L. Storrie-Lombardi. Infrared array camera (IRAC) observations of m81 . ApJS , 154 pp. 222–228, September 2004.
- [wu_spitzer/irs_2009] Yanling Wu, Vassilis Charmandaris, Jiasheng Huang, Luigi Spinoglio, and Silvia Tommasin. Spitzer/IRS 5-35 μm low-resolution spectroscopy of the 12 μm seyfert sample . ApJ , 701 pp. 658–676, August 2009.
Images
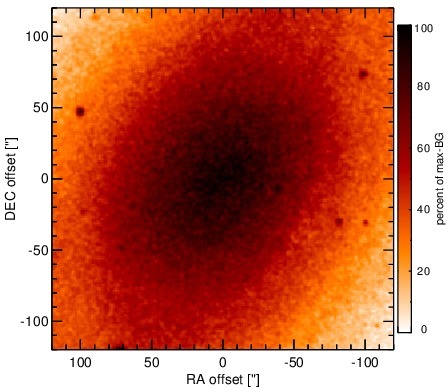
Optical image (DSS, red filter). Displayed are the central 4 arcmin with North being up and East to the left. The colour scaling is linear with white corresponding to the median background (BG) and black to the 0.01% pixels with the highest intensity.
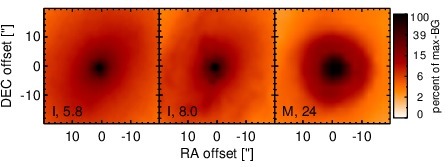
Spitzer MIR images. Displayed are the inner 40 arcsec with North being up and East to the left. The colour scaling is logarithmic with white corresponding to median BG and black to the 0.1% pixels with the highest intensity. The label in the bottom left states instrument and central wavelength of the filter in micron (I: IRAC, M: MIPS).
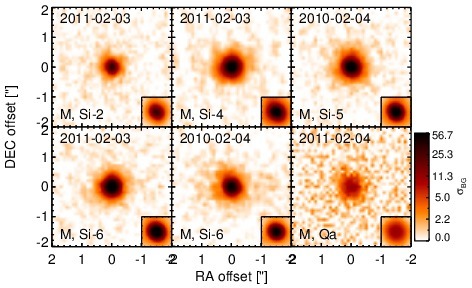
Subarcsecond-resolution MIR images sorted by increasing filter central wavelength. Displayed are the inner 4 arcsec with North being up and East to the left. The colour scaling is logarithmic with white corresponding to median BG and black to the 75% of the highest intensity of all images in units of sig_bg. The inset image (where present; either bottom or top right) shows the central arcsecond of the PSF from the calibrator star, scaled to match the science target. The labels in the bottom left state instrument and filter names (C: COMICS, M: Michelle, T: T-ReCS, V: VISIR).
SEDs
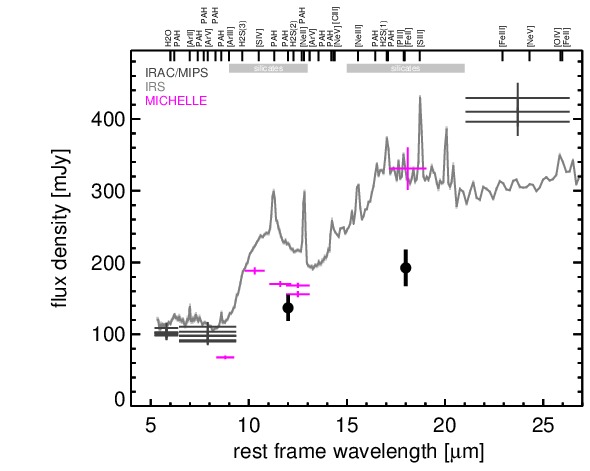
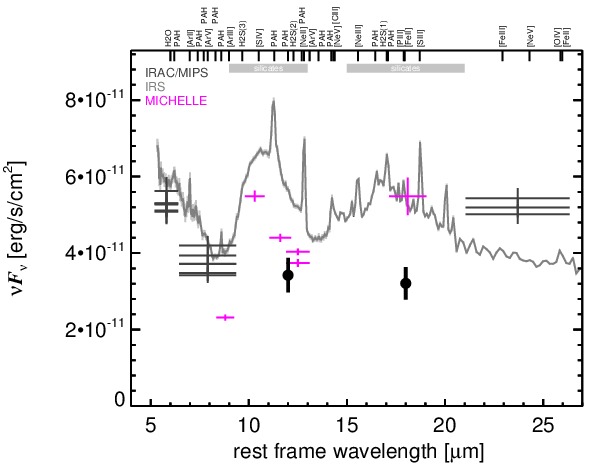
MIR SED. The description of the symbols in all the SED plots (where present) is the following: Grey crosses and solid lines mark the Spitzer/IRAC, MIPS and IRS data. The colour coding of the other symbols is as follows: green for COMICS, magenta for Michelle, blue for T-ReCS and red for VISIR data. Darker-coloured solid lines mark spectra of the corresponding instrument. The black filled circles mark the nuclear 12 and 18 micron continuum emission estimate from the data (where present). The ticks on the top axis mark positions of common MIR emission lines, while the light grey horizontal bars mark wavelength ranges affected by the silicate 10 and 18 micron features.