Sasmirala Individual Information for MCG-1-24-12
Description
MCG-1-24-12 is a spiral galaxy at a redshift of z = 0.0196 (D ~ 86.6 Mpc) with a Sy 2 nucleus [de_grijp_warm_1992], which was first discovered with HEAO [piccinotti_complete_1982, malizia_bepposax/pds_2002]. It belongs to the nine-month BAT AGN sample and has an extended NLR region with a PA= 75∘ [schmitt_hubble_2003]. Only Spitzer/IRS observations of MCG-1-24-12 are available. The corresponding LR staring-mode spectrum exhibits deep silicate 10 μm absorption and weak PAH emission and a red spectral slope in νFν-space (see also [mullaney_defining_2011]). In the WISE images, the object appears elliptically extended along the galaxy major axis. We observed MCG-1-24-12 with VISIR in three narrow N-band filters in 2009 and detected an unresolved MIR nucleus. Our nuclear photometry provides fluxes consistent with the Spitzer spectrophotometry. Therefore, we use the IRS spectrum to estimate the nuclear 12 μm continuum emission.
- [de_grijp_warm_1992] M. H. K. de Grijp, W. C. Keel, G. K. Miley, P. Goudfrooij, and J. Lub. Warm IRAS sources. II - optical spectroscopy of objects from the point source catalog . A&AS , 96 pp. 389–428, December 1992.
- [malizia_bepposax/pds_2002] A. Malizia, G. Malaguti, L. Bassani, M. Cappi, A. Comastri, G. Di Cocco, E. Palazzi, and C. Vignali. BeppoSAX/PDS identification of the true counterpart of the piccinotti source h0917-074 . A&A , 394 pp. 801–805, November 2002.
- [mullaney_defining_2011] J. R. Mullaney, D. M. Alexander, A. D. Goulding, and R. C. Hickox. Defining the intrinsic AGN infrared spectral energy distribution and measuring its contribution to the infrared output of composite galaxies . MNRAS , page 474, April 2011.
- [piccinotti_complete_1982] G. Piccinotti, R. F. Mushotzky, E. A. Boldt, S. S. Holt, F. E. Marshall, P. J. Serlemitsos, and R. A. Shafer. A complete x-ray sample of the high-latitude /absolute value of b greater than 20 deg/ sky from HEAO 1 a-2 - log n-log s and luminosity functions . ApJ , 253 pp. 485–503, February 1982.
- [schmitt_hubble_2003] H. R. Schmitt, J. L. Donley, R. R. J. Antonucci, J. B. Hutchings, and A. L. Kinney. A hubble space telescope survey of extended [o III] λ5007 emission in a far-infrared selected sample of seyfert galaxies: Observations . ApJS , 148 pp. 327–352, October 2003.
Images
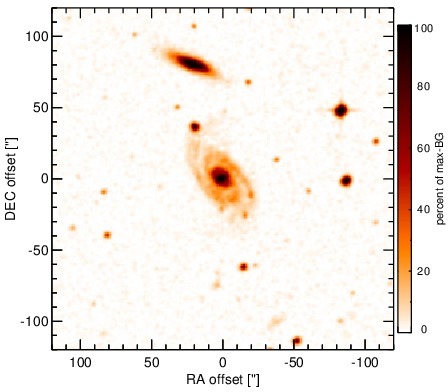
Optical image (DSS, red filter). Displayed are the central 4 arcmin with North being up and East to the left. The colour scaling is linear with white corresponding to the median background (BG) and black to the 0.01% pixels with the highest intensity.
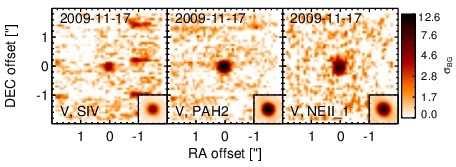
Subarcsecond-resolution MIR images sorted by increasing filter central wavelength. Displayed are the inner 4 arcsec with North being up and East to the left. The colour scaling is logarithmic with white corresponding to median BG and black to the 75% of the highest intensity of all images in units of sig_bg. The inset image (where present; either bottom or top right) shows the central arcsecond of the PSF from the calibrator star, scaled to match the science target. The labels in the bottom left state instrument and filter names (C: COMICS, M: Michelle, T: T-ReCS, V: VISIR).
SEDs
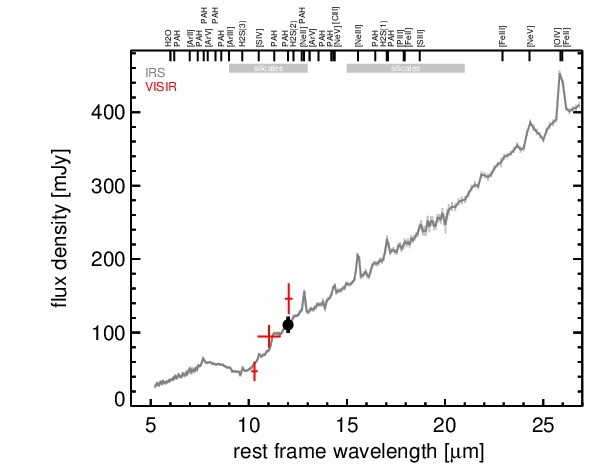
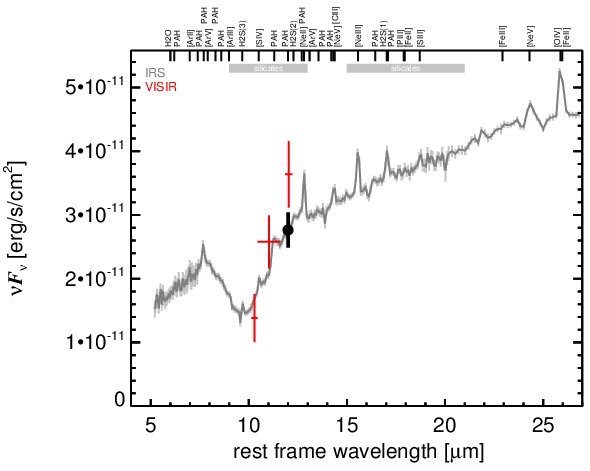
MIR SED. The description of the symbols in all the SED plots (where present) is the following: Grey crosses and solid lines mark the Spitzer/IRAC, MIPS and IRS data. The colour coding of the other symbols is as follows: green for COMICS, magenta for Michelle, blue for T-ReCS and red for VISIR data. Darker-coloured solid lines mark spectra of the corresponding instrument. The black filled circles mark the nuclear 12 and 18 micron continuum emission estimate from the data (where present). The ticks on the top axis mark positions of common MIR emission lines, while the light grey horizontal bars mark wavelength ranges affected by the silicate 10 and 18 micron features.