Sasmirala Individual Information for MCG-2-8-14
Description
MCG-2-8-14 is an edge-on spiral galaxy at a redshift of z = 0.0168 (D ~66.9 Mpc) with a Sy 2 nucleus [veron-cetty_catalogue_2010], which was discovered in the SDSS [hao_active_2005]. No Spitzer observations are available for MCG-2-8-14, which appears extended in the WISE images with similar morphology as in the optical images. The object was observed with VISIR in five narrow N-band filters in 2009 (unpublished, to our knowledge). A compact MIR nucleus is detect at shortest and longest wavelengths, while the source remained undetected in the central two filters. The low S/N of the detection prohibits any conclusion about the MIR subarcsecond morphology. The nuclear photometry indicates the presence of a deep silicate 10 μm absorption feature in the projected central ~ 100 pc of MCG-2-8-14.
- [hao_active_2005] Lei Hao, Michael A. Strauss, Christy A. Tremonti, David J. Schlegel, Timothy M. Heckman, Guinevere Kauffmann, Michael R. Blanton, Xiaohui Fan, James E. Gunn, Patrick B. Hall, Željko Ivezić, Gillian R. Knapp, Julian H. Krolik, Robert H. Lupton, Gordon T. Richards, Donald P. Schneider, Iskra V. Strateva, Nadia L. Zakamska, J. Brinkmann, Robert J. Brunner, and Gyula P. Szokoly. Active galactic nuclei in the sloan digital sky survey. i. sample selection . AJ , 129 pp. 1783–1794, April 2005.
- [veron-cetty_catalogue_2010] M.-P. Véron-Cetty and P. Véron. A catalogue of quasars and active nuclei: 13th edition . A&A , 518 pp. 10, July 2010.
Images
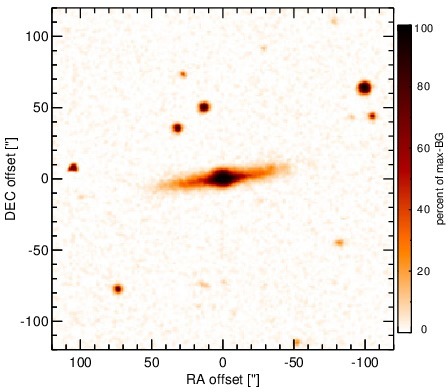
Optical image (DSS, red filter). Displayed are the central 4 arcmin with North being up and East to the left. The colour scaling is linear with white corresponding to the median background (BG) and black to the 0.01% pixels with the highest intensity.
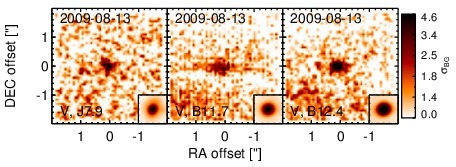
Subarcsecond-resolution MIR images sorted by increasing filter central wavelength. Displayed are the inner 4 arcsec with North being up and East to the left. The colour scaling is logarithmic with white corresponding to median BG and black to the 75% of the highest intensity of all images in units of sig_bg. The inset image (where present; either bottom or top right) shows the central arcsecond of the PSF from the calibrator star, scaled to match the science target. The labels in the bottom left state instrument and filter names (C: COMICS, M: Michelle, T: T-ReCS, V: VISIR).
SEDs
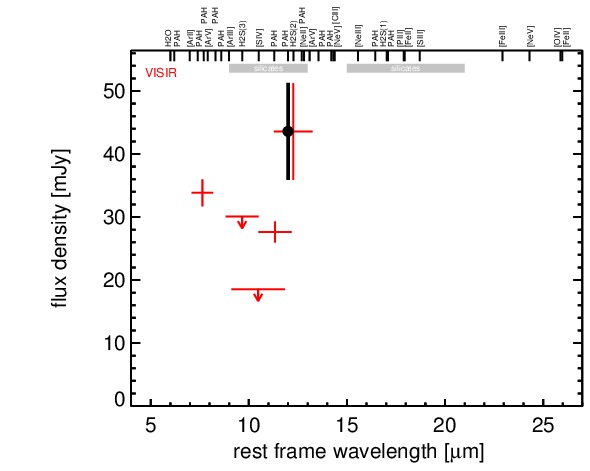
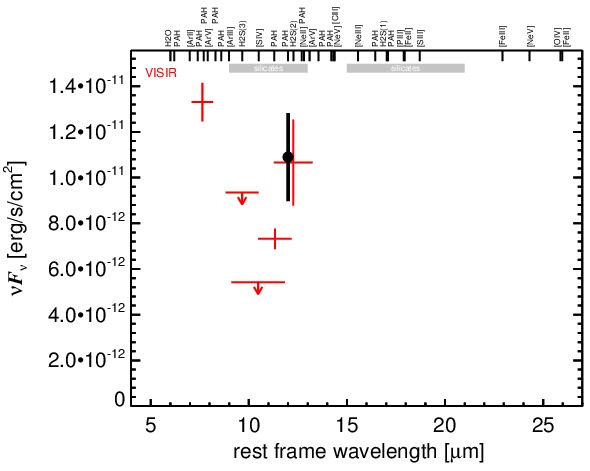
MIR SED. The description of the symbols in all the SED plots (where present) is the following: Grey crosses and solid lines mark the Spitzer/IRAC, MIPS and IRS data. The colour coding of the other symbols is as follows: green for COMICS, magenta for Michelle, blue for T-ReCS and red for VISIR data. Darker-coloured solid lines mark spectra of the corresponding instrument. The black filled circles mark the nuclear 12 and 18 micron continuum emission estimate from the data (where present). The ticks on the top axis mark positions of common MIR emission lines, while the light grey horizontal bars mark wavelength ranges affected by the silicate 10 and 18 micron features.